Every breakthrough starts with a single, insightful observation that sparks transformative change. Imagine a finance team facing challenges in pinpointing where profits are leaking. Sound familiar? Is your team spending a great deal of time analyzing countless datasets, only to come up with nothing of substance?

Needless to say, it’s time for a change.
Leveraging commercial analytics reveals key performance indicators (KPIs) that drive data-driven strategies, leading to measurable improvements in profitability and operational efficiency. Whether you’re a small business or a large enterprise, understanding your data is the key to staying competitive. If you’re looking for actionable ways to gain deeper insights, enhance customer experiences, and achieve sustainable growth, we’ve created a helpful cheat sheet to guide you through these strategies and help you take your business to the next level.
What Is Commercial Analytics in Finance?
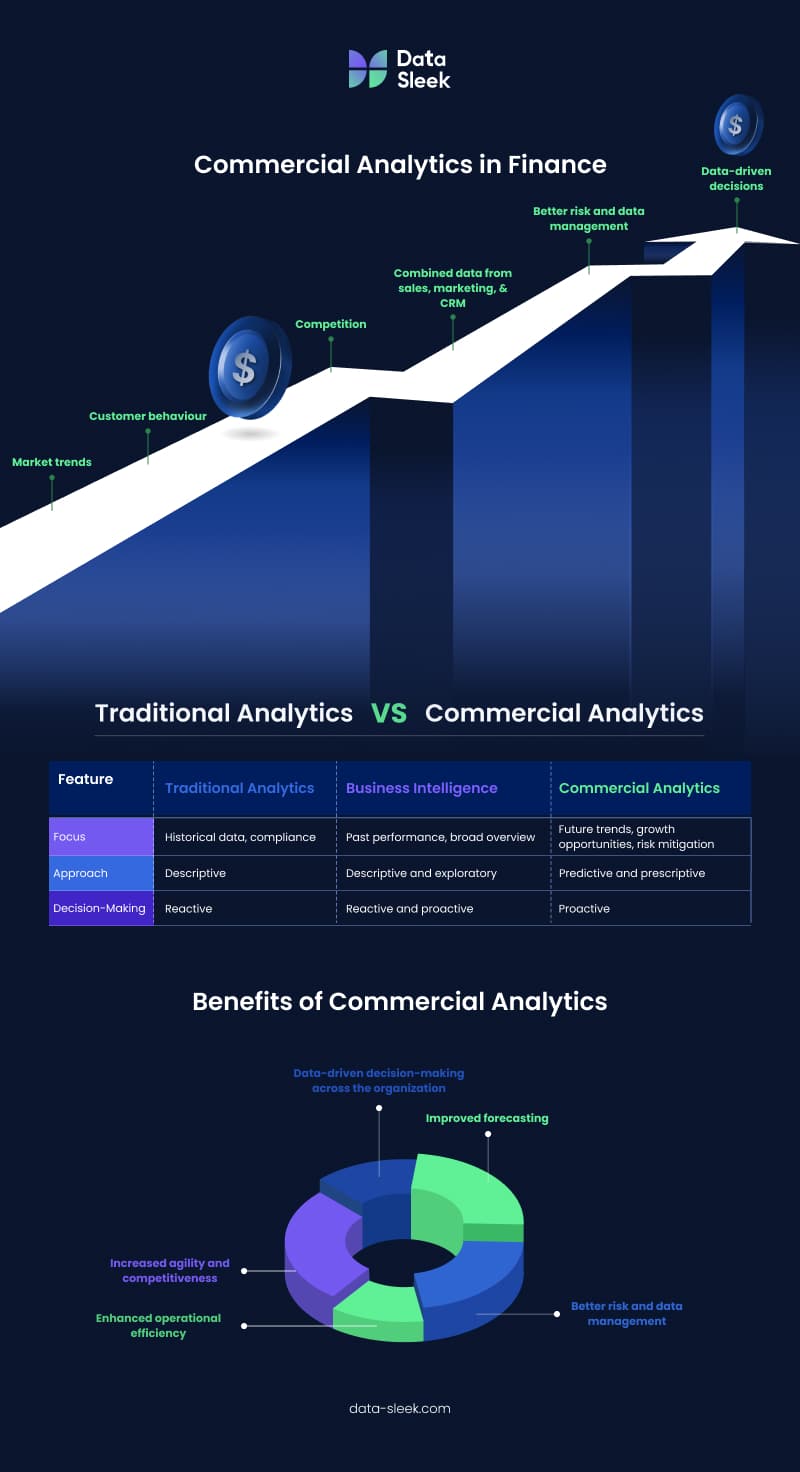
Commercial analytics in finance is more than just regular financial reports. It means looking at data from many places to see market trends, customer behavior, and competition. This helps guide important business decisions. This method gives a clear single source of truth for financial data. It removes data silos, allowing departments to work better together.
Combining data from sales, marketing, customer relationship management (CRM), and other relevant areas gives companies a clear vision of their financial situation. This complete view helps with accurate forecasting, better risk and data management, and decisions based on data across the organization.
How It Differs From Traditional Analytics and BI
Traditional financial analytics examines past data to create reports and ensure compliance. Business intelligence provides a broad overview of performance using historical data. In contrast, analytics commercial predicts future trends, identifies growth opportunities, and mitigates risks, emphasizing data-driven decisions across all functions.
It also offers a comprehensive view of operations by combining data from various sources, enabling smarter strategic decisions. This approach transforms financial management from merely reporting issues to actively using insights for decision-making, fostering a more agile and competitive business environment.
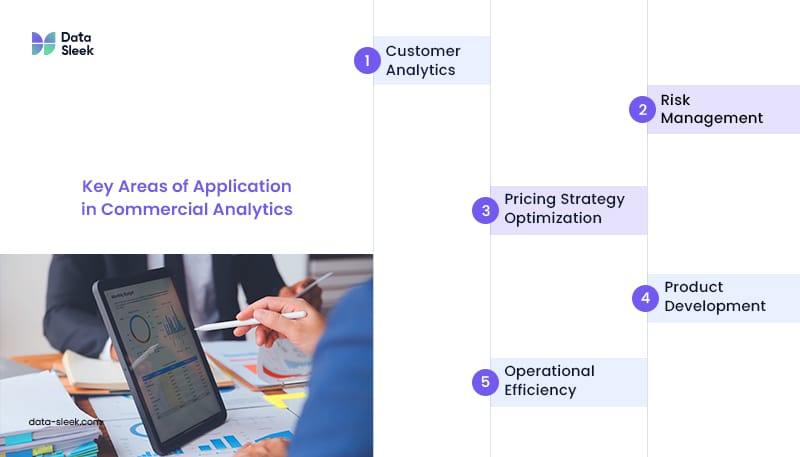
What Are the Key Areas of Application in Commercial Analytics?
Commercial analytics impacts various facets of finance, optimizing strategic and operational functions. Some key areas that demonstrate its transformative potential are:
Customer Analytics
This tool offers insights into segments, predicts behaviors, and creates personalized experiences that boost profits. Examining data lets you identify high-value customers, understand their preferences, and tailor global marketing campaigns.
Understanding customer segments allows businesses to allocate marketing budgets effectively, enhance retention, and drive revenue growth. Predictive analytics can foresee potential churn and enable proactive retention efforts. This fosters stronger relationships, promotes brand loyalty, and supports sustainable growth through personalized, data-driven strategies.
Risk Management
Commercial analytics enhances risk management by improving forecasting, identifying risks, and optimizing mitigation strategies. Analyzing past data, market trends, and economic signals helps create predictive models for credit risk, fraud detection, and portfolio management.
It also optimizes risk management plans by evaluating scenarios and financial impacts. KPIs like Fraud Detection Rate and Non-Performing Loan Ratio (NPL) are crucial for monitoring risks. Proactive risk identification and data-driven strategies enable financial institutions to navigate uncertain markets confidently.
Pricing Strategy Optimization
Pricing strategy is crucial for business success, and analytics commercial is key to optimizing it. Analyzing past sales, competitor prices, and market demand can set optimal prices for businesses that maximize profits without sacrificing market share.
Commercial analytics uses advanced algorithms to evaluate customer segments, product features, and market demand. This enables flexible pricing strategies tailored to different groups and conditions. Key performance indicators like Net Interest Margin (NIM) reflect the profitability of these strategies, leading to steady revenue growth and improved profits.
Product Development
Commercial analytics helps finance companies make data-driven decisions throughout product development, from ideation to launch and performance monitoring. Analyzing market trends, customer needs, and competitive offerings will help businesses to identify gaps and create successful products.
Market research and data analytics uncover opportunities, assess demand, and estimate potential profits. This approach reduces the risk of costly product failures and accelerates profitability, ensuring that new financial products contribute positively to the bottom line.
Operational Efficiency
This tool enhances operational efficiency by identifying problems, streamlining processes, and optimizing resource use. This approach cuts costs and boosts productivity by revealing inefficiencies and underutilized resources.
It improves resource utilization, inventory management, and logistics by moving from experience-based planning to data-driven decision-making. Automation and simplified workflows free up teams for critical projects. Financial KPIs like Return on Equity (ROE) and Loan-to-Deposit Ratio (LDR) ensure better financial health and increased profits.
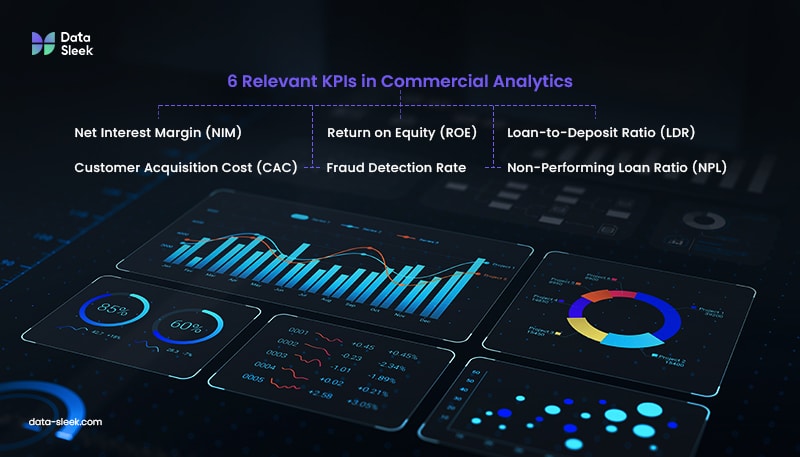
6 Relevant KPIs in Commercial Analytics
Finance professionals must focus on key performance indicators that provide actionable insights, including:
1. Net Interest Margin (NIM)
Net Interest Margin (NIM) measures the difference between the interest income generated by loans and the interest paid on deposits. This financial KPI is crucial for assessing the profitability of a bank’s lending activities. A higher NIM indicates that the bank effectively manages its interest rate spread, maximizing profitability. Closely monitoring NIM can help your business make informed decisions about interest rate adjustments and lending strategies to optimize financial performance.
2. Return on Equity (ROE)
Return on Equity (ROE) measures a company’s profitability with shareholders’ equity. It indicates how effectively a company uses its equity base to generate profits. A higher ROE signifies that the company efficiently utilizes its equity to produce earnings, making it an essential KPI for investors and stakeholders. When your business focuses on ROE, you can evaluate the effectiveness of its financial strategies and make adjustments to enhance shareholder value.
3. Loan-to-Deposit Ratio (LDR)
The Loan-to-Deposit Ratio (LDR) measures the ratio of a bank’s total loans to its total deposits. This KPI provides insights into a bank’s liquidity and lending practices. An optimal LDR indicates that the bank effectively balances its lending activities with its deposit base, ensuring sufficient liquidity to meet withdrawal demands. Monitoring LDR helps finance professionals manage liquidity risk and maintain a healthy balance between loans and deposits.
4. Customer Acquisition Cost (CAC)
Customer Acquisition Cost (CAC) measures the cost of acquiring a new customer. This financial KPI is critical for evaluating the efficiency of marketing and sales efforts. Analyzing CAC can determine the effectiveness of customer acquisition strategies and identify areas for improvement. Lowering CAC while maintaining or increasing customer lifetime value (CLV) can significantly enhance profitability.
5. Fraud Detection Rate
The Fraud Detection Rate measures the effectiveness of a company’s fraud detection systems. A higher rate indicates better fraud prevention, which is vital for maintaining financial integrity and protecting against losses. Advanced analytics and machine learning enhance fraud detection, minimizing its impact. In fact, the financial sector’s AI spending in 2023 was estimated at $14.6 billion, with growth expected through 2027.

6. Non-Performing Loan Ratio (NPL)
The Non-Performing Loan Ratio (NPL) measures the percentage of loans in default or close to default. This KPI is a key indicator of credit risk and portfolio quality. A lower NPL ratio signifies that the bank’s loan portfolio is healthy and borrowers meet their repayment obligations. Closely monitoring NPL can identify potential credit risks early and implement strategies to mitigate them, ensuring the stability and profitability of the loan portfolio.
What Are the Tools and Techniques in Commercial Analytics?

Finance professionals use various tools to harness analytics commercially. Machine learning algorithms are crucial for predictive modeling and identifying patterns. These algorithms quickly process vast data, uncovering insights missed by manual analysis. Data visualization tools, like dashboards and reports, present complex data clearly, enhancing understanding. Predictive modeling platforms simulate scenarios, helping finance teams anticipate outcomes and make informed decisions.
Advanced analytics platforms integrate multiple data sources, providing a comprehensive view of financial operations. Features like real-time data processing, anomaly detection, and automated reporting enhance efficiency and accuracy. These capabilities ensure finance professionals can rely on timely and precise data to guide their strategies.
Natural language processing (NLP) tools analyze unstructured data, such as customer feedback and social media interactions, offering deeper insights into customer sentiment and market trends. These advanced tools and techniques drive more effective decision-making and achieve better financial outcomes.
Want to Elevate Commercial Analytics? Data Sleek Is Here to Help!
Focusing on customer analytics, risk management, and pricing strategy optimization can unlock insights that propel your organization forward. Integrate essential KPIs and leverage Data Sleek’s advanced tools to drive sustainable growth!
Master the art of commercial analytics to stay ahead of the competition! Contact us today for a free consultation, more insights, and personalized solutions!

Frequently Asked Questions About Commercial Analytics
Here are some common questions about commercial analytics to help you better understand its impact and implementation.
How often should KPIs be reviewed?
KPIs should be reviewed monthly or quarterly to identify trends and adjust strategies. Regular reviews ensure KPIs remain relevant to business goals and aligned with evolving market conditions. This proactive approach helps maintain a competitive advantage.
How can finance teams track KPIs?
Use data visualization dashboards and performance management systems. Foster data literacy within the team to generate actionable insights, enabling more informed decision-making.
What tools are essential for commercial analytics?
Key tools include machine learning algorithms, data visualization platforms, and predictive modeling software to uncover insights and drive decisions. These tools streamline data processing and enhance analytical accuracy.
How does commercial analytics improve profitability?
Commercial analytics drives profitability and growth by optimizing pricing strategies, enhancing risk management, and improving operational efficiency. It enables businesses to make data-driven decisions that maximize financial performance.


