Metabase vs. Tableau Introduction
Navigating the world of business intelligence tools can be a complex endeavor. This comprehensive comparison of ‘Metabase vs. Tableau’ will guide you through the key features, pricing strategies, and customization capabilities of each, helping you decide which BI tool aligns best with your business requirements.
Two powerful BI tools, Metabase and Tableau, have gained significant popularity and are widely recognized for their capabilities.
In this blog, we will explore the key features, advantages, and limitations of both Metabase and Tableau, helping you make an informed decision on which tool is right for your organization’s specific needs.
| Criteria | Metabase | Tableau |
| Ease of Use and User Interface | User-friendly with intuitive navigation | User-friendly with customizable interface |
| Features and Functionality | Basic data visualization and exploration | Advanced visualization and powerful analytics |
| Dashboard Creation and Sharing | Interactive dashboards with some limitations | Robust and flexible dashboarding environment |
| Integration and Compatibility | Seamless integration with various databases | Extensive connectivity options and third-party support |
| Cost and Licensing | Open-source with free and paid versions | Commercial tool with various licensing options |
| Total Cost of Ownership (TCO) | Cost-effective, lower upfront costs | Higher upfront costs, additional enterprise features and support |
Make Informed Decisions. Schedule a free consultation to evaluate between Metabase and Tableau to make the right choice for your business.
Overview of Metabase
Introduction to Metabase
Metabase, a popular Business Intelligence tool, has gained recognition for its ability to help organizations unlock valuable insights from their data.
Founded in 2015, Metabase was developed with a mission to make data analysis accessible to all users, regardless of their technical expertise.
It has quickly gained traction among businesses of all sizes, thanks to its user-friendly interface and powerful features.
Metabase offers a range of key features and functionalities that enable users to explore and visualize data effectively.
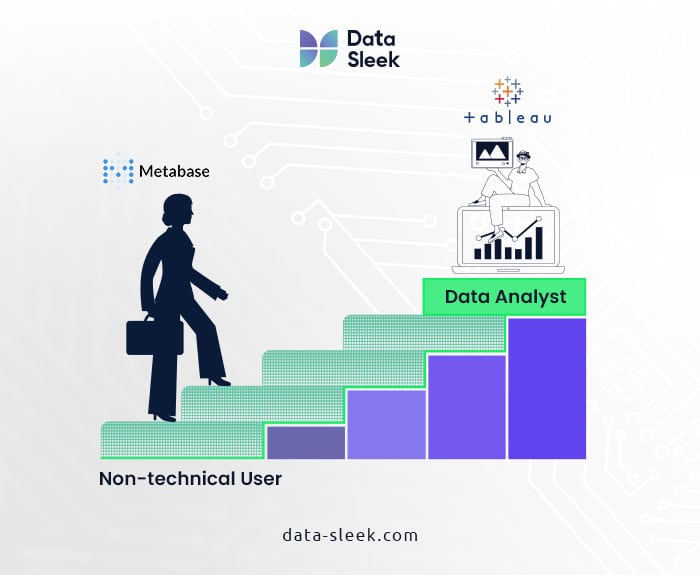
With its intuitive interface, even non-technical users can easily navigate and derive insights from complex datasets.
The data visualization tool supports a variety of data sources, including SQL databases, CSV files, and cloud-based solutions, making it versatile and compatible with different data environments.
Advantages of Metabase
Ease of Use and User-Friendly Interface
One of Metabase’s greatest strengths is its simplicity and ease of use. The tool focuses on providing a user-friendly experience, allowing users to create queries, build interactive dashboards, and generate reports with minimal effort.
Metabase’s intuitive interface, drag-and-drop functionality, and visual query builder make it accessible to users at all skill levels, eliminating the need for extensive technical training.
Open-Source Nature and Cost-Effectiveness
Metabase is an open-source BI tool, which means it is freely available to download, use, and modify.
This open-source nature makes it an attractive choice for data teams with limited budgets, as it eliminates the need for expensive licensing fees.
Moreover, the active open-source community surrounding Metabase contributes to continuous improvements and the development of new features, ensuring that users have access to a dynamic and evolving tool.
Natural Language Querying Capabilities
Metabase incorporates natural language querying, allowing users to interact with their data using plain English sentences.
This feature enables non-technical users to ask questions in a conversational manner and receive instant responses in the form of visualizations or tables.
Natural language querying eliminates the need to write SQL queries or have coding knowledge, making data exploration more accessible and efficient.
Seamless Integration with Various Databases
Metabase offers seamless integration with a wide range of databases, including popular ones like MySQL, PostgreSQL, and MongoDB, as well as cloud-based platforms like Google BigQuery and Amazon Redshift.
This flexibility in database compatibility enables organizations to connect and analyze data from multiple sources, creating a unified view of their information. The ability to connect to diverse databases empowers business users to work with data they have, regardless of its location or format.
Limitations of Metabase
Limited Advanced Visualization Options
While Metabase provides a solid foundation for data exploration and basic visualizations, it may lack some of the advanced visualization options offered by other BI tools. Users who require intricate visual representations or complex chart types may find the capabilities of Metabase somewhat limited. However, for most standard data visualization needs, Metabase offers a sufficient range of charts and graphs.
Less Robust Enterprise-Level Features
Metabase, as an open data source BI tool, may not offer the same level of enterprise-level features and capabilities as some commercial solutions.
Organizations with complex data governance requirements, advanced security needs, or intricate scalability demands may find that Metabase falls short in addressing those specific requirements. However, for small to mid-sized businesses or teams looking for a user-friendly BI tool, Metabase can still serve as a valuable solution.
Relatively Smaller Community and Ecosystem
Compared to some other widely adopted BI tools like Tableau or Power BI, Metabase has a relatively smaller community and ecosystem. This can result in fewer readily available plugins, integrations, and community-developed
Overview of Tableau
Introduction to Tableau
Tableau is a leading Business Intelligence tool that has revolutionized the way organizations do data analysis and visualization.
Founded in 2003, Tableau has become synonymous with powerful data visualization and analytics capabilities. It has gained a strong reputation for its user-friendly interface and versatile features, making it a top choice for businesses across industries.
Tableau offers a comprehensive set of features and functionalities that empower users to explore, analyze, and communicate insights effectively.
Its intuitive drag-and-drop interface allows users to create visualizations and build dynamic dashboards without the need for extensive coding or technical expertise.
With its focus on delivering data-driven storytelling, Tableau enables users to uncover valuable insights and make data-driven decisions.
Advantages of Tableau
Wide Range of Advanced Visualization Options
Tableau provides a vast array of visualization options, allowing users to create visually stunning and interactive representations of their data.
From basic charts and graphs to advanced visualizations like heat maps, treemaps, and geographic maps, Tableau server offers a wide range of choices to effectively communicate complex data. Its intuitive interface makes it easy to customize and refine visualizations to suit specific business intelligence needs.
Comprehensive Data Connectivity and Integration
Tableau supports seamless integration with various data sources, including databases, spreadsheets, cloud services, and more.
It offers native connectors to popular databases like MySQL, Microsoft SQL Server, Oracle, and ensuring that users can connect and analyze data from multiple sources.
This comprehensive data connectivity enables users to consolidate and analyze diverse datasets within a unified platform.
Powerful Analytics and Data Exploration Capabilities
Tableau provides robust analytics and data exploration tools to uncover patterns, trends, and outliers within datasets.
It offers advanced calculations, statistical functions, and predictive analytics capabilities, empowering users to perform complex analyses and derive deeper insights.
Tableau’s drag-and-drop interface simplifies the process of manipulating data, applying calculations, and creating calculated fields, enhancing the overall analytical experience.
Strong Community Support and Extensive Training Resources
Tableau boasts a vibrant and active community of users and developers who actively contribute to its growth and development.
This strong community support provides a wealth of resources, including forums, user groups, and knowledge-sharing platforms.
Additionally, Tableau offers extensive training resources, including online courses, tutorials, and certifications, enabling users to enhance their skills and maximize their utilization of the tool.
Limitations of Tableau
Steeper Learning Curve for Beginners
While Tableau offers a user-friendly interface, it may have a steeper learning curve for users who are new to data visualization and analysis.
The tool’s extensive capabilities and features require some time and effort to fully grasp and utilize effectively.
However, with the available training resources and community support, users can overcome this challenge and unlock Tableau’s full potential.
Higher Cost for Enterprise-Level Deployments
Tableau is known for its robust features and enterprise-grade capabilities, but this comes at a higher cost compared to some other business intelligence tools.
The licensing fees for Tableau can be significant, especially for larger-scale deployments or organizations with big data needs.
However, organizations should consider the overall value and return on investment that Tableau can deliver through its advanced features and comprehensive BI capabilities.
Limited Natural Language Querying Capabilities
Tableau’s strength lies in its visual analytics capabilities rather than natural language querying. While it provides some level of natural language processing, it may not offer the same level of advanced natural language querying capabilities as other BI tools.
Users who heavily rely on conversational queries may find Tableau’s natural language capabilities somewhat limited. However, Tableau’s visual interface compensates for this limitation by providing an intuitive and interactive data exploration experience.
Comparison of Metabase and Tableau
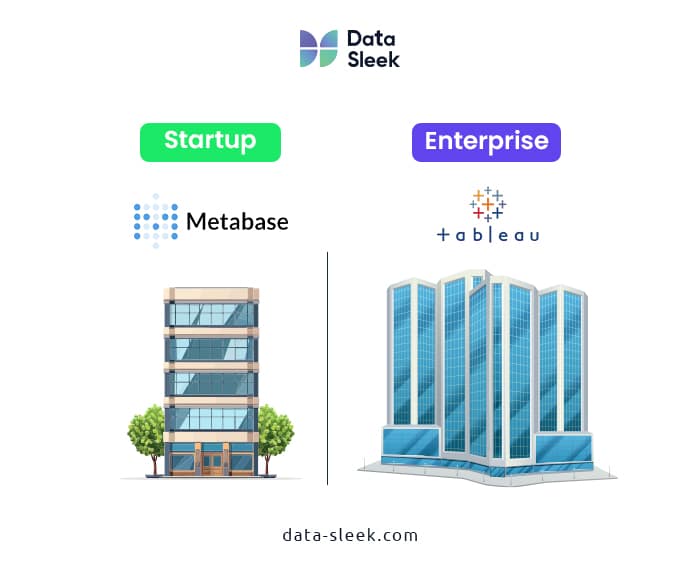
Metabase and Tableau are two popular Business Intelligence (BI) tools with distinct strengths and features. Both tools offer a free version for users to try. The key differences between the two tools are illustrated below.
Metabase stands out for its user-friendly interface, ease of navigation, and cost-effectiveness as an open data source tool. It provides basic data visualization and exploration capabilities and allows users to create interactive dashboards.
On the other hand, Tableau offers advanced visualization options, powerful analytics, and a highly customizable interface. It excels in creating dynamic and visually appealing dashboards. Tableau also provides extensive connectivity options, a larger ecosystem of third-party integrations, and more flexible licensing options.
However, Tableau comes with higher upfront costs, which organizations should consider alongside their specific requirements when evaluating the total cost of ownership.
Choosing the Right BI Tool for Your Needs
Assessing Your Requirements
When selecting the appropriate BI tool, it is crucial to assess your organization’s specific needs and use cases. Identify the key objectives and challenges you aim to address with a BI tool. Consider factors such as the type and volume of data you handle, the number of users, and the level of technical expertise within your organization. Additionally, evaluate the available resources, including budget and IT infrastructure, to determine what level of investment is feasible.
Evaluating Key Factors
To make an informed decision, evaluate key factors that align with your organization’s priorities:
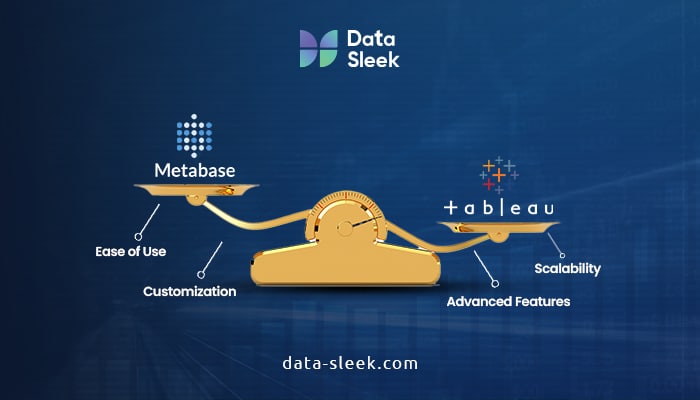
- Ease of Use, Advanced Features, and Scalability: Consider the balance between user-friendliness and the availability of advanced features. Determine if the tool’s capabilities align with your current and future requirements. Assess scalability to ensure the BI tool can accommodate the growth of your organization’s data and user base.
- Financial Implications and Budget Constraints: Analyze the cost structure of each BI tool. Compare licensing models, subscription fees, maintenance costs, and additional expenses such as training and support. Consider the long-term financial implications and ensure the chosen tool fits within your budget constraints.
Making an Informed Decision
To make a well-informed decision, follow these steps:
- Utilize Trial Versions, Demos, and User Reviews: Take advantage of trial versions or demos offered by BI tool providers. This allows you to explore the features, user interface, and functionality firsthand. Additionally, read user reviews and case studies to gain insights into real-world experiences with the tools.
- Seek Feedback from Relevant Stakeholders and IT Experts: Involve key stakeholders, such as department heads and data analysts, in the evaluation process. Understand their specific requirements and seek their input on the shortlisted BI tools. Consult with IT experts or consultants who can provide technical insights and guidance based on your organization’s unique needs.
By systematically evaluating your requirements, weighing key factors, and gathering insights from trials and expert feedback, you can confidently select the BI tool that best aligns with your organization’s needs and maximizes its potential for data-driven decision-making.
A final signpost to consider: If your team regularly finds itself exporting data to Excel to answer ‘why’ questions that dashboards can’t, it may be worth exploring AI-native analytics — a newer approach that uses the data warehouse itself as the query engine.


