
A mid-market company decides it needs to get serious about data. It buys Snowflake. It layers on a BI tool. It hires two data engineers to build pipelines, then a consultant to write a governance policy. Eighteen months and several hundred thousand dollars later, the dashboards exist, the warehouse is running — and nobody in the room can state the business problem any of it was purchased to solve.
This is not a technology failure. Every one of those decisions was defensible in isolation. It is a sequencing failure and the single most expensive pattern we see in mid-market data.
A data strategy framework is not an architecture diagram, a tool shortlist, or a set of pillars on a slide. It is a sequence. It runs in three phases — Contextualization, Ideation, and Prescription — and it starts with a question, not a purchase.
This article walks through all three, including the artifacts each produces: a data SWOT, a data asset inventory, a use case specification, and a weighted scoring model that ranks competing initiatives. The methodology draws on the framework taught in UC Berkeley Haas’s data strategy program, adapted for companies that have a P&L to defend rather than a data office to staff.
Why Most Data Strategies Fail Before Phase One
The Tool-First Trap
The pattern is consistent enough to be predictable. A company recognizes it has outgrown spreadsheets and disconnected systems. The first instinct is to buy the thing that seems foundational — a cloud warehouse. Then the warehouse needs data in it, so pipelines get built. Then the data needs to be visible, so a BI layer gets added. Then somebody notices two departments report different revenue numbers, so governance gets bolted on.
Each step follows logically from the last. The problem is that the whole chain follows from a purchase decision rather than a business decision. By the time anyone asks “what is this for,” the answer has to be reverse-engineered from what was already built.

The cost shows up later. Gartner found that 63% of organizations either do not have, or are unsure whether they have, the right data management practices for AI — based on a survey of 248 data management leaders. “Unsure” is the more damning half of that number. It describes companies that have spent the money and still cannot tell you what they got for it.
What a Data Strategy Actually Is — and is not
Three terms get used interchangeably and shouldn’t be:
| Term | What it is | What it answers |
|---|---|---|
| Data stack | The collection of tools — warehouse, pipelines, transformation layer, BI | What are we running? |
| Data strategy | The plan connecting data investment to specific business outcomes | Why are we running it, and what is it worth? |
| Data strategy framework | The repeatable sequence for producing that plan | How do we decide what to build first? |
Most companies that say they have a data strategy have a data stack and a budget line. That is not the same thing. A data strategy tells you which of two competing initiatives to fund when you can only afford one — and just as importantly, gives you a defensible reason to tell the other sponsor no.
The Three Phases of the Data Strategy Framework
| Phase | The work | The output |
|---|---|---|
| 1. Contextualization | Organize your thoughts. Where is the company now, what does it want, and what data does it already have? | Data SWOT + data asset inventory |
| 2. Ideation | Generate ideas — expressed as use cases, then scored against weighted criteria | Prioritized use case shortlist |
| 3. Prescription | Produce the plan: projects, operational changes, timeline, budget, measures of success | Data strategy roadmap + budget + KPI dashboard |
One clarification on the third phase, because the naming matters. Prescription is the plan, not the build. Implementation is what happens after the data strategy exists. Collapsing the two is how companies end up “doing data strategy” for eighteen months with nothing to show a board — the strategy work never ends because it was never distinguished from the engineering work. Prescription has a deliverable and a finish line.

The phases are sequential, but the framework is not a waterfall. Phase 3 routinely sends you back to Phase 2, for reasons we’ll get to.
Phase 1: Contextualization — Establish the Business Context
Contextualization is the work of understanding the environment your data strategy will actually live in. It runs from two perspectives: the organization perspective and the data perspective.
Start with the organization perspective
Every Data-Sleek engagement opens with the same question, and it is not a data question:
What is your business strategy?
Not “what are your reporting requirements?” Not “what’s in your stack.” What is the company trying to become, and what does it have to be true for that to happen?
Most companies already have this documented. A corporate strategy typically comprises a vision (aspirational—the compass that sets direction), a mission (how some part of that vision is achieved: what activities, what cost, what timeline, what result), and a list of business priorities that cascade into initiatives and operations.
The data strategy must either align with that or be the mechanism for realizing it. Those are different postures, and it’s worth knowing which one you’re in. Aligning means data support priorities set elsewhere. Being the mechanism means a business priority is unachievable without a data capability, which puts you in a much stronger position to ask for budget.
This question gets skipped for understandable reasons: it feels like it’s already been answered. The strategy deck exists. But “grow revenue 20%” is not a data problem statement, and translating it into one is the actual work of this phase.
Run a data SWOT
A data SWOT captures how data — or the absence of it — affects the business. It is a standard 2×2 with two axes that people routinely get backwards:
- Left column = internal. Things the company can decide to change.
- Right column = external. Things the company can only decide how to react to.
- Top row = advantageous. Bottom row = disadvantageous.
Here is what one looks like filled in for a mid-market insurance carrier — not an empty template, because empty templates are where workshops die:
| Advantageous | Disadvantageous | |
|---|---|---|
| Internal | Strengths· Six years of clean, complete transaction history· Policy documents already digitized and searchable · No storage of compromisable customer financial data | Weaknesses· Customer records live in three systems with no shared key· Claims adjuster notes are unstructured free text · Underwriting data updates on a 24-hour lag |
| External | Opportunities· Carriers in adjacent lines will pay for benchmark loss data· Acquirers pay a premium for clean data rooms · Regulators moving toward standardized reporting formats | Threats· A competitor announced an AI-assisted quoting tool· A third-party enrichment feed moves from free to paid next year · Brokers increasingly rate carriers on quote turnaround |
Two things about this phase that teams get wrong.
First, do not prioritize. The data SWOT categorizes observations; it does not rank them. It is tempting to start arguing about which weakness is worst. Resist it. Prioritization happens in Phase 2, against explicit criteria, with the whole idea set visible. Arguing about priority now means arguing without the information you need.
Second, be honest in the bottom-left quadrant. The weaknesses column is the one that gets sanitized when the CIO is in the room, and it is the quadrant that generates the highest-scoring use cases later. A data SWOT that only lists strengths produces a data strategy that only funds vanity projects.
Build — or audit — a data asset inventory
The second half of contextualization is knowing what you actually have. A data asset inventory is a comprehensive catalog of every dataset the company holds. It is a database in its own right, and it should be maintained like one.
If you already have one, audit it on four axes:
- Completeness of coverage — does it account for all the company’s data, or the convenient subset?
- Completeness of description — does it tell you everything you need to know about each asset?
- Quality — is the inventory itself correct, and does it list only data that actually exists?
- Currency — is it up to date? Data availability changes; inventories rot quietly.
If you don’t have one, build it with these nine fields:
| Field | The question it answers |
|---|---|
| ID | How is this dataset uniquely identified? |
| Designation | What is this data? |
| Purpose | What is it used for now — not what it could be used for |
| Source | Where does it come from? Which system, department, partner, or supplier? |
| Rights | Who owns it, and who is permitted to use it for what? |
| Volume | How much is there, and what does it cost to store and maintain? |
| Format | Raw or transformed? Structured tables or unstructured text, images, documents? |
| Growth rate | How fast is it growing or shrinking? How often is it updated — and how often does it need to be? What’s the retention policy? |
| Veracity | What state is it in? Can you rely on it being correct, current, and complete — and if not, how is it wrong? |
The Rights field is the one that surprises people, so it’s worth being explicit: owning data does not automatically mean you are permitted to use it however you like, and not owning it does not automatically mean you can’t. Contractual use rights, consent scope, and jurisdictional restrictions all cut across ownership. We have watched more than one promising use case die in legal review three months after it was funded, over a question that took four minutes to answer at inventory time.
The inventory also serves a quiet second purpose. In Phase 2, every use case must reference the existing data it depends on by inventory ID. If a use case references data that isn’t in the inventory, either the inventory is incomplete or the use case is assuming data you don’t have. Both are worth finding out early.
Working with a stack you’ve outgrown? Contextualization is where most of our data strategy consulting engagements start — usually because the client has plenty of data and no agreed account of what it’s for. Book a free consultation if that sounds familiar.
Phase 2: Ideation — Turn Business Problems Into Scored Use Cases
Why brainstorming is not ideation
This is the phase that makes executives nervous. The objection is always some version of the same thing: “How are we supposed to just come up with good ideas about how to use our data? Is there anything more systematic than randomly brainstorming?”
Yes. Ideation is creative, but it can be done systematically, and the mechanism is simple: express every idea as a use case, and require every use case to reference the contextualization work. An idea that can’t point back to a specific SWOT observation isn’t an idea, it’s an enthusiasm.
What a use case actually is
A use case is a specification of a user + a system + an interaction that achieves a goal.
- User — a customer, employee, or partner
- System — the environment in which that user operates
- Interaction — the execution of a business process
- Goal — a business result: revenue, profit, cost, satisfaction, cycle time
Concretely: An underwriter (user), working in the policy administration system (system), reviews a submission and issues a quote (interaction), with the goal of reducing average quote turnaround from three days to four hours (goal).
That is a use case. “Improve underwriting with AI” is not.
The eleven attributes that make a use case evaluable
Document use cases as a table — one row per use case, one column per attribute. A fully specified use case carries eleven:
ID · Description · Purpose · Type of value · Data gap · Organizational change considerations · Customer impact considerations · Partner impact considerations · Financial investment requirement · Time investment requirement · Benefits
Most of these are self-explanatory. Three are where mid-market teams consistently fail.
Purpose — must be a formal reference, not a rationale. The description can be informal. The purpose cannot. It has to point at one or more specific items in your data SWOT. Every SWOT item is a justification for doing something, so a use case’s purpose is simply: this leverages strength S2 and defends against threat T1. Anyone reading the table months later immediately understands why it was on the list. Use cases whose purpose is a paragraph of prose rather than a reference are almost always somebody’s pet project looking for a home.
Type of value — pick one of five. Classifying the value sharpens the argument considerably:
| Type of value | What it means |
|---|---|
| New product or service | The data is itself part of what you sell |
| Improved operations | Data enables you to create, change, or eliminate an operation |
| Improved intelligence | You learn more about your market, customers, partners, or competitors |
| Productized data | The data is a product in its own right — sold, rented, or licensed |
| Enhanced company valuation | The data, or how you manage it, makes the company worth more |
That last one is a multiplier rather than a peer of the others, and it is chronically underused in mid-market. A company that has demonstrably secured customer data, or that can hand an acquirer a clean data room, is worth more than an identical company that can’t — without changing a single operational process. If an exit is anywhere on the horizon, valuation belongs in your criteria.
Data gap — four questions, and “better” is not “more.” The gap is the difference between the data you have and the data the use case needs:
- Existing data — what can be used as-is? (Reference by inventory ID.)
- More data — what additional data of the same type is required?
- Better data — what additional data of a different type is required?
- Improved data — what fixes to existing data are required?
The distinction between more and better is where estimates go wrong. A use case about responding faster to unhappy customers needs sentiment data. You may already have sentiment data in the form of free-text social comments — but if the use case requires sentiment scored 1–5 to trigger a workflow, unstructured text isn’t a smaller version of that. It’s a different thing, and closing that gap is a different project with a different cost.
For improved data, three questions decide whether existing data is usable: Does the use case depend on the data being self-consistent (a single source of truth, not three partners spelling the same customer three ways)? Does it depend on the data being correct (a fleet-average efficiency calculation tolerates errors; identifying the one asset that caused an outage does not)? And is it from a reliable and preferred source — or from a partner who can change their measurement methodology without telling you?
Score the use cases — the model that kills your pet project
Eventually, you have a pool of ideas and have to choose. Criteria should cover alignment with corporate strategy, required investment, expected return, and anything else that drives business results. Then — and this is the part most companies skip — prioritize the criteria before you score anything.
Assign each criterion a priority from 1 to 5. Assign each use case a level of support for each criterion, 1 to 5. Multiply. Sum. Rank.
Here is a complete worked example. A company has identified three SWOT items it considers critical (detailed customer preference data as a strength, limited customer contact data as a weakness, a competitor’s newly announced product as a threat) and wants growth quickly without a large capital outlay:
| Criterion | Priority (1–5) | UC1 Develop a new data product | UC2 Gather customer contact data | UC3 Share contact data with a supplier |
|---|---|---|---|---|
| Supports corporate strategy | 5 | 5 | 4 | 4 |
| Leverages a strength: detailed preference data | 2 | 5 | 1 | 1 |
| Fortifies a weakness: limited contact data | 2 | 1 | 5 | 5 |
| Defends against a threat: competing product | 4 | 4 | 2 | 2 |
| Increases profit | 2 | 3 | 3 | 3 |
| Increases revenue | 3 | 5 | 3 | 3 |
| Increases number of customers | 4 | 5 | 3 | 3 |
| Small financial investment | 2 | 2 | 5 | 3 |
| Small time investment | 5 | 1 | 3 | 3 |
| Total score | 103 | 92 | 88 |
The arithmetic is deliberately simple. UC1’s level of support for corporate strategy is 5, the criterion’s priority is 5, so that cell contributes 5 × 5 = 25. Its support for the preference-data criterion is also 5, but that criterion’s priority is only 2, so it contributes 10. Sum the row: 25 + 10 + 2 + 16 + 6 + 15 + 20 + 4 + 5 = 103. UC1 wins, UC2 is next, UC3 is the weakest candidate.
Notice what the model surfaces. UC1 scores highest overall despite scoring worst on time investment — the single highest-priority criterion. That tension is the useful output. It tells leadership exactly what they are trading and lets them argue over priority weightings rather than over whose idea is better.
Which brings up the thing worth saying plainly, because most published frameworks won’t: the priorities are subjective, and that is the point. This model does not compute a right answer. It makes judgment explicit, debatable, and documented. That is precisely why it survives an executive meeting — the disagreement moves from “I don’t like your project” to “I think time-to-value should be weighted 5, not 3,” which is an argument a group of adults can actually resolve.
What this looks like in practice
A commercial insurance client came to us with a directive that will sound familiar: increase revenue.
That is a business goal, not a data problem statement, and no data strategy can be built from it. Contextualization is what turned it into one. Working through the organizational perspective and the data SWOT, the constraint surfaced: brokers were routing submissions to whichever carrier quoted fastest, and underwriting approval times were causing deals to lose out before price ever entered the conversation. Revenue wasn’t a pricing problem. It was a cycle-time problem with a data cause — underwriters were assembling risk information manually from three disconnected systems.
That reframing changed which use cases were even on the table, and the winning one scored high precisely where the company was most constrained: time to value. The build that followed was narrow on purpose. The outcome was a 90% reduction in manual reporting effort and a 3× increase in KPI visibility — and, more to the point, the AI components worked, because the data underneath them had been assembled to answer one specific question rather than to be generically “AI-ready.”
We did not start with the data. We started with the business. Through the Contextualization phase, the specific bottleneck emerged: underwriting approval times were creating delays that were costing the business jobs it should have been winning. The underwriting delays weren’t obvious from the data alone. We ran workshops with the operations team, mapped every step in the process, and that’s how we pinpointed exactly where time was being lost.
Read the full Tradesman Insurance case study for the architectural details.

Phase 3: Prescription — Build the Data Strategy Roadmap
Prescription is where selected use cases become a funded plan. The deliverable is a data strategy roadmap: what gets done, when, by whom, at what cost, and how you will know it worked.
What belongs in the roadmap
A complete data strategy roadmap has five components. Missing any one of them is what turns a roadmap into a wish list:
- Projects — the one-time activities required to implement each use case
- Operations considerations — the ongoing activities that must change, start, or continue as a result
- Expected business results — stated as numbers, tied back to the use case benefits
- Timeline — when projects start and stop, and when the business results should appear
- Measures of success — agreed in advance, not reconstructed afterward
Component 2 is the one that gets dropped, and it’s expensive. A use case that requires an underwriter to review an exception queue every morning has created an ongoing operational obligation, not just a project. If nobody costed that, the ROI is wrong.
Keep the traceability between the roadmap and the use cases. In project management terms the use cases are your business requirements; catalog them so that when the roadmap changes you can see which requirements moved, and when a requirement changes you can see which projects are affected.
Expect the roadmap to contradict your estimates
The financial and time estimates you made in Phase 2 were order-of-magnitude guesses, made before you knew which use cases would be selected and before anything was sequenced. Once the roadmap exists, the real numbers appear — and they may be higher or lower. Sequencing cuts both ways: implementing one use case often makes the next one dramatically cheaper, and occasionally makes it slower.
When the corrected estimates would have changed your scoring, iterate. The loop is:
Adjust use case attributes → recalculate the scoring model → reselect use cases → revise the roadmap.
This loop is the most commonly omitted part of any published data strategy framework, and its absence is why so many strategies are quietly abandoned rather than formally revised. The estimates will be wrong. A framework that has no mechanism for being wrong is not a framework, it’s a document.
Track relevance, not just delivery
Build a dashboard, and put two categories of indicator on it.
The first is standard project health: on time, on budget, milestones cleared. The second is the one almost nobody builds: is this still the right strategy? Business conditions move, competitors ship, new capabilities become cheap. A use case that scored 103 in March may not score 103 in October. Reviewing the scoring model on a fixed cadence — quarterly is usually right for mid-market — is what keeps the roadmap from becoming a monument to a decision nobody remembers making.
Who Needs to Be in the Room
The framework describes work; people do it. How you gather input determines the quality of everything above.
Three engagement modes, in ascending order of commitment:
| Mode | Participation | Best for |
|---|---|---|
| Surveys | Lowest | Breadth. Specific questions for the SWOT, inventory, use case attributes, and scoring — plus open-ended fields to catch what you didn’t think to ask. |
| Interviews | Medium | Depth and adaptability. You can follow a thread. |
| Workshops | Highest | The interaction between participants. Half a dozen to two dozen people, off-site, minimal distractions, explicit agenda, named facilitators. |
They compose well: survey broadly, interview those whose responses were either unusually thin or unusually insightful, then invite the right people to a workshop. In practice, workshops produce more complete and more imaginative strategies than either of the other two, precisely because of the cross-functional argument they force.
Six participant types belong on the team:
- Facilitators — to drive the agenda and capture decisions, issues, and dissent
- Leadership with authority to approve — there is no point doing this work without the person who signs off
- Experienced practitioners — people whose jobs depend on, produce, or would change with data; they surface the use cases nobody else can see
- Business function representatives — sales, marketing, finance, operations, customer service, IT, HR
- Data subject matter experts — the reality check on what is easy, hard, feasible, and impossible
- Potential implementation team members — a project manager, an architect, an analyst
The failure mode is worth naming: a data strategy built only by the people who already manage the data will be myopic. It will optimize the systems those people own and miss the business problems they never see.
How This Framework Compares to DAMA-DMBOK, Gartner, and McKinsey
Three established frameworks are worth knowing, and it’s worth being precise about what each one actually is — because they don’t all operate at the same layer.
| Framework | Type | Best for | What it gives you | What it doesn’t |
|---|---|---|---|---|
| DAMA-DMBOK | Reference model | Regulated enterprises with a standing data office | 11 knowledge areas covering governance, quality, architecture, security — the most complete taxonomy available | A sequence, or any way to choose between two initiatives |
| Gartner’s 7 Building Blocks | Maturity model | Assessing where you currently stand | A shared vocabulary and a credible benchmark for board conversations | A route. It describes a destination |
| McKinsey data strategy | Consulting methodology | Enterprises tying data investment to enterprise value | The strongest value-linkage logic of the three | Accessibility — it’s built for engagements priced well above mid-market |
| AWS Prescriptive Guidance | Implementation guidance | Teams already committed to AWS | Concrete architectural patterns | Business-side prioritization; it starts after the strategy questions are settled |
| Contextualization → Ideation → Prescription | Procedure | Mid-market companies that have outgrown their systems | A sequence with three named deliverables and a scoring model for choosing | Exhaustive governance taxonomy — use DMBOK for that |
The honest framing: DMBOK and Gartner are reference models; this is a procedure. They are not competitors, and claiming to beat DMBOK on coverage would be silly. DMBOK tells you what good data management contains. It does not tell you which of your eleven possible projects to fund in Q1 with the budget you actually have. That gap — between knowing what a data strategy contains and knowing what to do Monday morning — is what this framework is for.
Data Strategy Before AI Strategy
Here is the claim most vendors won’t make: data strategy is not a prerequisite for AI strategy. It is the AI strategy.
The evidence keeps accumulating. S&P Global Market Intelligence found that the share of companies abandoning most of their AI initiatives jumped to 42%, up from 17% the prior year, across more than 1,000 respondents in North America and Europe — with an average of 46% of proofs of concept scrapped before reaching production. Gartner, separately, predicts that through 2026 organizations will abandon 60% of AI projects unsupported by AI-ready data.
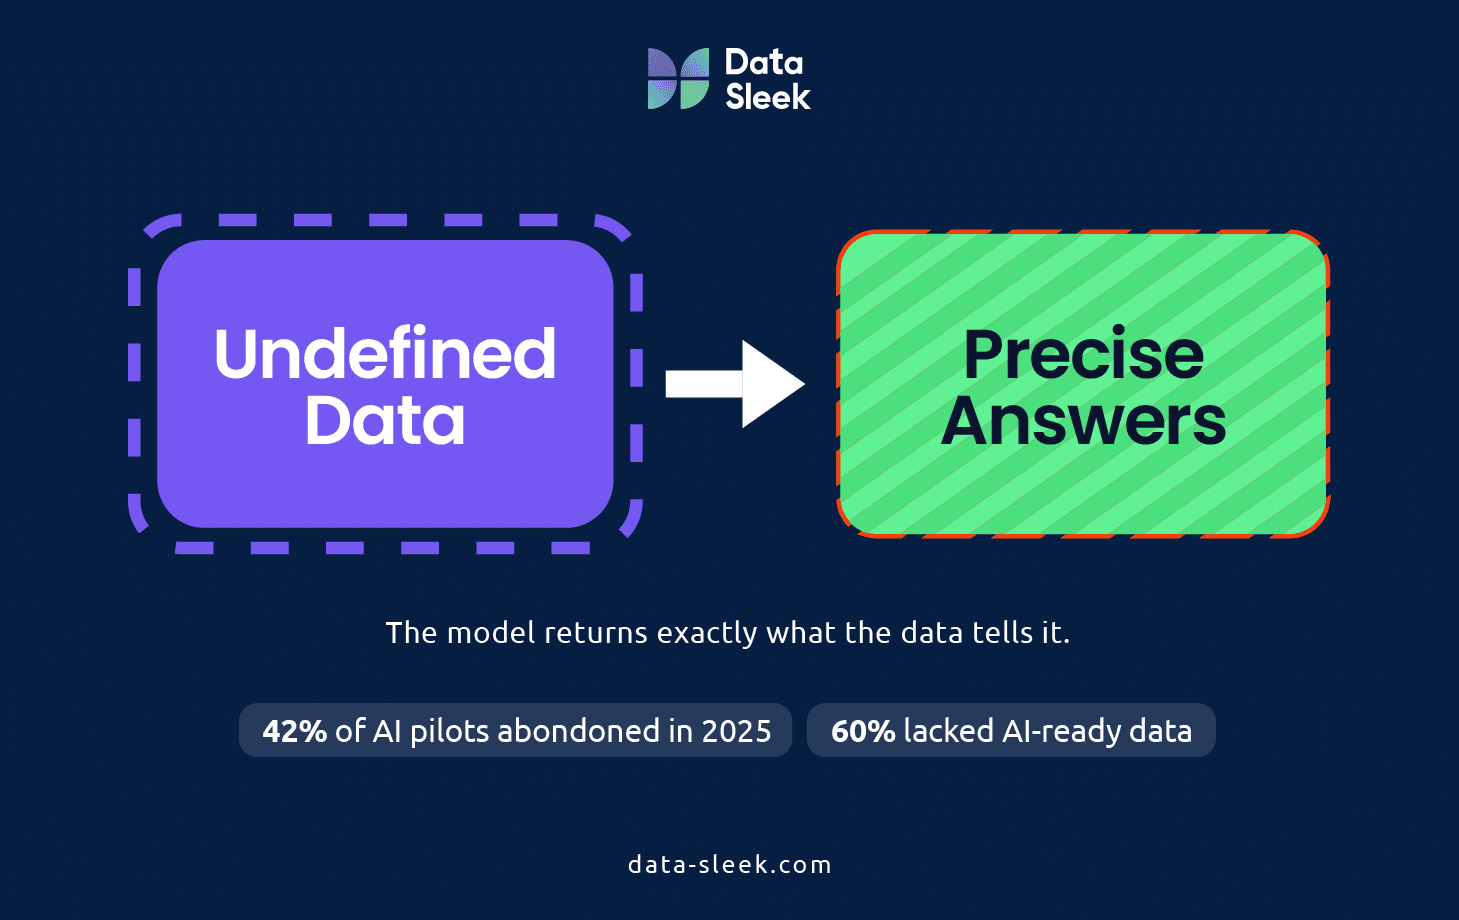
Read those two together and the diagnosis is clear. The models are not the problem. Model quality has improved faster than almost anyone forecast. What fails is everything upstream: data that isn’t consistent, isn’t defined the same way twice, isn’t reliable enough to act on, and — most often — was never scoped to a specific business question in the first place.
Which is why “AI-ready data” is a misleading phrase. It implies a general state of readiness you can achieve and then draw from. There is no such state. Data is ready for a question, not for a technology. The insurance client above had AI working not because their data crossed some readiness threshold, but because the underwriting data had been assembled to answer one question that scored high enough to fund.
If you’re evaluating AI initiatives now, run them through Phase 2 before Phase 3. An AI use case is subject to exactly the same scoring model as everything else, and it should have to win on the merits. Our AI and ML consulting work almost always starts by finding the upstream data gap, not by selecting a model — and for a broader look at the pattern, see why AI projects fail in mid-market companies.
Why the Sequence Matters
AI-ready data is not a separate workstream from data strategy. It is a byproduct of doing data strategy correctly. When the C>I>P framework is applied, the Contextualization phase produces a specific business problem statement. The Ideation phase maps that problem to the data it requires. The Implementation phase builds that data to a standard the business is willing to act on. That standard is, by definition, what AI-ready data requires.
The organizations that will compound a durable AI advantage over the next three years are not the ones that chose the right model. They are the ones that asked the right business question first, built their data around the answer, and then applied AI to a foundation that was designed to support it.
McKinsey’s 2025 State of AI research found that AI high performers are nearly three times as likely to have fundamentally redesigned workflows as part of their AI efforts. That redesign does not start with the model. It starts with a clear business problem and the data strategy built to address it. If that work has not started yet, the C>I>P framework is where it begins.

Where to Start If You Have No Data Strategy at All
The instinct is to fix everything: clean all the data, catalog all the systems, govern all the domains. That project has no endpoint, no sponsor, and no moment where anyone can declare victory. It is the second most reliable way to waste a data budget, right behind buying a warehouse first.
Do this instead. Take one high-priority business problem and run it through all three phases end to end. Not a light version of all three phases across the whole business — a complete pass on one problem.
- Contextualization — build the SWOT and inventory scoped to what that problem touches
- Ideation — generate three to five use cases, specify them properly, score them
- Prescription — build a roadmap for the winner with a real timeline and a real measure of success
You will finish in weeks, not quarters. You will have a working example of the framework that your team has actually used, which is worth ten times a framework they’ve only read. And you’ll have one measurable business outcome to point at when you ask for the budget to do the next one.
Then expand. The SWOT grows, the inventory grows, the scoring model gets reused, and the second cycle is meaningfully faster than the first.
Ready to run the first cycle? We do this with mid-market companies as a scoped engagement with a fixed deliverable — a data SWOT, a scored use case shortlist, and a funded roadmap. Book a free consultation or explore our data strategy consulting services.

Your Business Strategy Deserves a Data Strategy Built Around It
The C>I>P framework is not a template. It is a process that starts with your specific business problem and builds only what solving it requires.
Frequently Asked Questions
What is a data strategy framework?
A data strategy framework is a repeatable process for developing a data strategy — the plan that connects data investment to business outcomes. It is distinct from a data stack (the tools) and from a data strategy (the plan itself). Its job is to tell you what to decide, in what order, and how to choose between competing initiatives.
What are the three phases of a data strategy framework?
Contextualization (understand the business context and the data you have, producing a data SWOT and a data asset inventory), Ideation (generate ideas as specified use cases and score them against weighted criteria), and Prescription (turn the selected use cases into a funded roadmap with a timeline and measures of success).
How is a data strategy roadmap different from a technology roadmap?
A technology roadmap is organized around platform capabilities and vendor release cycles — what you will upgrade and when. A data strategy roadmap is organized around business questions that need to be answered, and it sequences work according to the business value score. The two often contain similar projects in different orders, and the order determines whether the investment pays back.
How do you prioritize data use cases?
Use a weighted scoring model. Define criteria (strategy alignment, investment required, expected return, and anything else driving business results), assign each criterion a priority from 1 to 5, then assign each use case a level of support for each criterion from 1 to 5. Multiply priority by support for each cell, sum per use case, and rank. The weightings are subjective by design — the model makes judgment explicit and debatable rather than replacing it.
How long does it take to develop a data strategy?
For a mid-market company running the framework against a single high-priority business problem, six to ten weeks is realistic: two to three weeks of contextualization, two to three weeks of ideation and scoring, and two to four weeks to build the roadmap and budget. Attempting to cover every business domain at once is what turns a ten-week exercise into an eighteen-month one.
How do you know if your organization needs a data strategy engagement?
The clearest signal is a gap between data investment and business impact. If your team cannot draw a direct line between the infrastructure they maintain and a decision the business is making better because of it, the strategy work has not been done.
Glossary
Data Strategy
A plan that connects data investments to specific business outcomes. It defines which problems to solve, in what order, and what data capabilities are required to solve them.
Data Stack
The collection of tools an organization uses to move, store, and analyze data. A data stack is infrastructure. It is not a strategy.
C>I>P Framework
Data-Sleek’s three-phase methodology: Contextualization defines the business problem, Ideation maps it to required data capabilities, and Prescription produces a plan.
Contextualization
Phase 1. Establishing business context and data reality; produces a data SWOT and data asset inventory.
Ideation — Phase 2. Generating and scoring use cases; produces a prioritized shortlist.
Prescription — Phase 3. Converting selected use cases into a funded roadmap. Distinct from implementation, which follows the strategy.
Data SWOT — A 2×2 analysis of how data affects the business: internal strengths and weaknesses, external opportunities and threats.
Data asset inventory — A catalog of all company data, described across nine fields: ID, designation, purpose, source, rights, volume, format, growth rate, veracity.
Use case — A specification of user + system + interaction achieving a goal, documented across eleven attributes.
Scoring model — A weighted matrix ranking use cases by priority-weighted level of support against agreed criteria.
Data gap — The difference between the data a company has and the data a use case requires, broken into existing, more, better, and improved data.
AI-Ready Data
Data that is reliable, consistently defined, and scoped to the business question an AI model is being asked to answer. It is produced by doing data strategy correctly, not by a separate data quality initiative.


