The energy sector stands as one of the largest contributors to global carbon emissions, responsible for more than 70% of worldwide greenhouse gas (GHG) emissions. This significant impact primarily results from burning fossil fuels such as natural gas, oil, and coal to power transportation, electricity generation, and heating. Despite the continuous rise in global energy demand, there is mounting pressure on the sector to reduce its carbon footprint and align with sustainability goals. As the heat from global warming and climate change intensifies, the urgency for the energy sector to act has never been greater.
In response to the growing risks associated with climate change, organizations and enterprises are increasingly turning to carbon analytics to assess and manage carbon risks effectively. Given the vast scale and complexity of energy systems, traditional manual reporting and estimation methods are no longer sufficient. Instead, carbon analytics enables businesses to identify high-impact areas, make data-driven decisions, monitor emissions in real time, and forecast future trends. This article delves into the role of carbon emission analytics, the critical data and tools involved, and how data-driven approaches can accelerate carbon reduction efforts in the energy sector.
Introduction to Carbon Reduction
Reducing carbon emissions is a fundamental priority for businesses committed to a sustainable future and combating global warming. Understanding your organization’s greenhouse gas emissions through carbon footprinting is the first step in any effective carbon reduction strategy. By measuring and tracking their carbon footprint, companies gain a clear picture of where emissions are generated across their operations and supply chain. Carbon accounting and sustainability reporting are essential components that enable businesses to identify high-impact areas for improvement and set meaningful sustainability goals.
With accurate data in hand, organizations can make informed, data-driven decisions to reduce their carbon emissions, enhance operational efficiency, and demonstrate progress to stakeholders. Proactive carbon reduction not only helps mitigate the risks of climate change but also delivers a competitive advantage by improving brand reputation, meeting regulatory requirements, and responding to growing customer and investor expectations. Ultimately, integrating carbon reduction into business strategy supports long-term sustainability and positions companies as leaders in the transition to a low-carbon economy.
Understanding Carbon Analytics
Carbon analytics is the systematic process of collecting, processing, and analyzing greenhouse gas emissions data to provide organizations with actionable insights. While carbon dioxide (CO₂) is the most tracked greenhouse gas due to its volume and impact, other gases like methane (CH₄) and nitrous oxide (N₂O) are also included in comprehensive analyses. By integrating emissions data from multiple sources and performance metrics, carbon analytics enables companies to understand where, how, and why emissions occur, empowering them to make informed decisions for carbon reduction. Carbon analytics also allows organizations to calculate their carbon emissions accurately by using specific methodologies or tools designed for precise assessment.
Data Sources in Carbon Analytics
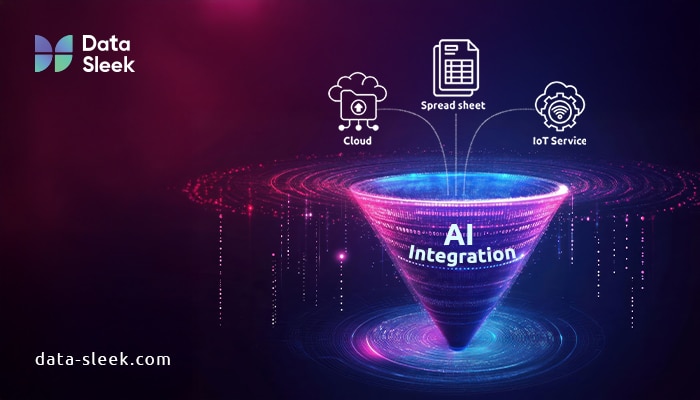
To develop an accurate emissions profile, organizations gather diverse data inputs, including:
- Fuel consumption records detailing the amount and type of fossil fuels used.
- IoT sensor data that monitor energy use and emissions in real time.
- Electricity and energy usage logs from various operational units.
- Emission monitoring systems that track direct and indirect greenhouse gas emissions.
- Supply chain and logistics data that capture emissions embedded in procurement and transportation activities, including emissions information from each supplier. This supports supplier-level emissions tracking and risk mitigation.
By consolidating these raw data streams, businesses can create a comprehensive picture of their carbon footprint across their value chain.
Key Performance Metrics Tracked
Once data is collected, it is transformed into measurable indicators that reflect carbon performance. These indicators are then measured to assess progress and impact. Some of the essential metrics include:
- CO₂ equivalent (CO₂e): A standardized unit expressing the combined impact of all greenhouse gases in terms of carbon dioxide.
- Emissions intensity: The amount of emissions generated per megawatt hour (MWh) of energy produced.
- Carbon abatement potential: The expected reduction in emissions resulting from specific investments or strategies.
- Energy intensity: Energy consumed per unit of production or economic output.
- Scope 1, 2, and 3 emissions: Categorization of emissions by source, where Scope 1 represents direct emissions from owned sources, Scope 2 covers indirect emissions from purchased energy, and Scope 3 includes all other indirect emissions across the value chain.
Understanding and tracking these metrics are essential for organizations aiming to manage their carbon footprint effectively and meet sustainability targets.
The Role of Data in Emissions Monitoring and Reporting
Accurate, timely, and granular data forms the foundation for effective carbon emissions monitoring and sustainability reporting. Without reliable emissions data, companies cannot precisely measure their environmental impact, identify reduction opportunities, or comply with evolving regulatory requirements. A digital platform can centralize emissions data, automate reporting processes, and integrate with other business systems, streamlining sustainability efforts and enhancing transparency.
Emissions Monitoring
Modern emissions monitoring relies heavily on sensor-based intelligence and automation. Key technologies include:
- IoT sensors and smart meters that provide continuous data on energy use and emissions.
- Satellite and remote sensing tools such as Sentinel-SP and NASA’s OCO-2, which offer large-scale environmental monitoring.
- Supervisory Control and Data Acquisition (SCADA) systems that oversee industrial processes and energy flows.
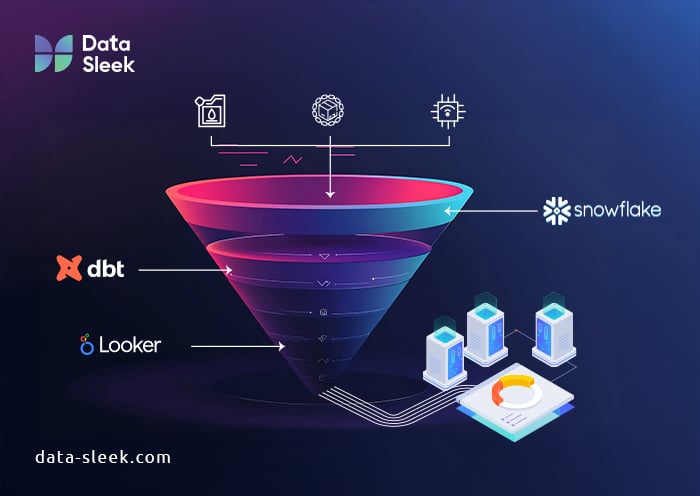
To interpret this vast data, organizations utilize platforms like Tableau and Looker for visual trend analysis and dashboarding, cloud data warehouses such as BigQuery, Snowflake, Singlestore to centralize emissions databases, and integration tools like Fivetran and Airbyte to sync data from disparate sources. These tools enable businesses to track emissions in real time, benchmark performance, and promptly identify operational inefficiencies or anomalies.
With these tools, organizations can track emissions in real time, benchmark performance, and quickly identify operational inefficiencies or anomalies.
Carbon Emissions Reporting
As climate disclosures shift from voluntary to mandatory, the need for accurate emissions data becomes critical for external reporting. Analytics platforms help organizations clean, organize, and validate raw data to meet stringent reporting standards. Tools like data build tool (dbt) streamline the transformation of messy data into reliable reporting layers.
Companies must align their emissions reporting with several global and regional standards, including:
- The Carbon Disclosure Project (CDP), a widely recognized framework for corporate emissions transparency.
- The Greenhouse Gas (GHG) Protocol, which structures emissions data across Scopes 1, 2, and 3.
- SEC Climate Disclosure Rules requiring detailed emissions and climate risk reporting for U.S. public companies.
- The EU Corporate Sustainability Reporting Directive (CSRD), mandating comprehensive emissions and ESG disclosures for large European companies.
These frameworks ensure transparency, enable automated compliance, and support organizations in demonstrating progress toward science-based targets and net zero commitments.
Identifying Emission Hotspots Through Analytics
While measuring total emissions is crucial, pinpointing emission hotspots within an organization’s operations is where carbon analytics truly adds value. By analyzing operational data, companies can uncover hidden areas of high emissions and take targeted actions to address them.
Operational Inefficiencies
Sometimes, elevated emissions result not from faulty equipment but from suboptimal operational practices. Carbon analytics allows teams to scrutinize time-series data from SCADA systems and sensors, revealing inefficiencies in process flows, scheduling, or equipment use. Even minor improvements in operations can translate into significant carbon savings, enabling businesses to optimize their energy use without major capital investments.
Equipment-Level Issues
In other cases, emission hotspots stem from aging, poorly maintained, or misconfigured equipment that emits more greenhouse gases than expected. Analytics tools help compare emissions across different sites or units, detect abnormal performance trends, and trigger automated alerts when emissions exceed baseline levels. Platforms like Looker or custom dashboards in BigQuery provide real-time anomaly detection, helping technicians quickly identify and address underperforming assets.

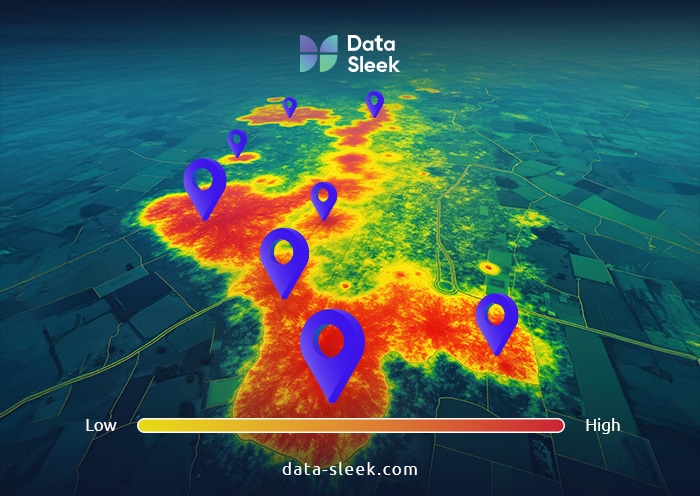
Site and Geographic-Level Patterns
Analyzing emissions patterns across multiple facilities and geographic locations offers further insights. By combining emissions data with Geographic Information System (GIS) information, organizations can evaluate emissions intensity relative to environmental factors, regional policies, and weather patterns. This comprehensive view supports strategic decisions, such as focusing on sustainable procurement from suppliers in low-emission regions or prioritizing renewable energy investments in specific locations.
Supply Chain Emissions Management
Managing emissions across the supply chain is critical for businesses aiming to reduce their overall carbon footprint and achieve ambitious sustainability goals. Scope 3 emissions—those that occur indirectly throughout the value chain, from raw material extraction to product delivery—often represent the largest share of an organization’s total greenhouse gas emissions. Addressing these emissions requires a comprehensive approach to sustainable procurement and close collaboration with sustainable suppliers.
By leveraging carbon intelligence tools and platforms, businesses can collect and analyze emissions data from every stage of the supply chain. These solutions provide actionable insights that help organizations identify hotspots, measure progress, and implement targeted improvements. Sustainable procurement practices, such as selecting suppliers with strong environmental credentials and optimizing logistics, further support the reduction of scope 3 emissions. Through continuous monitoring and engagement, companies can drive meaningful change across their value chain, enhance transparency, and accelerate progress toward their sustainability goals.
Predictive Analytics for Proactive Emissions Management
Reducing carbon emissions effectively requires anticipating future challenges rather than merely reacting to past data. Predictive analytics leverages machine learning, historical emissions data, and statistical modeling to forecast emissions trends and support proactive management.
Emissions Forecasting
By analyzing historical emissions alongside operational variables such as weather conditions, energy demand, and fuel consumption, companies can develop precise forecasts of future emissions. This capability enables better planning of production schedules, alignment with long-term sustainability goals, and identification of seasonal or demand-driven emission spikes, allowing organizations to mitigate their impact before it occurs.
Anticipating Regulatory Risks
Emissions thresholds are not just numbers; they carry legal and financial consequences. As climate disclosure regulations evolve globally, organizations must understand their risk exposure to avoid penalties and reputational damage. Predictive analytics provides foresight into potential compliance issues, helping businesses stay ahead of regulatory requirements and maintain transparency with investors and other stakeholders.
Data-Driven Strategies for Emission Reduction
Data does more than reveal where emissions originate—it guides organizations on how to reduce them effectively. By harnessing real-time and historical data, businesses can implement smarter, faster, and more cost-efficient carbon reduction strategies. Data-driven decision making enables organizations to prioritize actions and allocate resources effectively for maximum sustainability impact.

Some key benefits of data-driven approaches include:
- Uncovering hidden inefficiencies that traditional methods might miss.
- Revamping operational processes to minimize emissions without sacrificing productivity.
- Precisely identifying underperforming assets that require maintenance or replacement.
- Assessing the carbon abatement potential of new technologies or systems.
- Gradually transitioning to renewable energy sources and low-carbon alternatives without disrupting business operations.
Such strategies help companies demonstrate measurable progress toward sustainability goals, achieve competitive advantage, and contribute to a sustainable future.
Setting Science Based Targets
Setting science-based targets is a vital step for businesses seeking to align their carbon reduction efforts with the latest climate science and contribute to limiting global warming to 1.5°C. Science-based targets provide a clear, measurable pathway for reducing greenhouse gas emissions in line with what is necessary to achieve a sustainable future. By adopting these targets, organizations demonstrate their commitment to meaningful climate action and position themselves as sustainability leaders.
The GHG Protocol offers a robust framework for setting and tracking science-based targets, ensuring consistency and credibility in carbon accounting and sustainability reporting. Businesses can use advanced tools to measure emissions across their operations and supply chain, generate reports, and track progress toward their targets. This process not only helps identify areas for improvement but also supports transparent communication with stakeholders and regulatory bodies. By setting and achieving science-based targets, companies can drive continuous improvement, meet their sustainability goals, and build resilience in a rapidly changing business environment.
Net Zero Emissions Strategies
Achieving net zero emissions is an essential goal for businesses committed to addressing climate change and securing a sustainable future. Net zero strategies focus on reducing greenhouse gas emissions as much as possible and offsetting any remaining emissions through credible carbon removal initiatives. To reach net zero, organizations must embed sustainable practices throughout their supply chain, invest in renewable energy, and enhance energy efficiency across all business operations.
Carbon accounting and sustainability reporting tools play a crucial role in helping businesses track progress, identify opportunities for improvement, and communicate achievements to external stakeholders such as customers and investors. Advanced technologies, including machine learning, enable companies to optimize their emissions reduction efforts, automate compliance, and generate actionable insights with just a few clicks. As expectations for corporate climate action rise, achieving net zero not only reduces regulatory risks but also strengthens brand reputation and delivers a competitive advantage. By prioritizing net zero strategies, businesses can lead the way toward a low-carbon economy and inspire others to follow suit.
Overcoming Data and Integration Challenges
Despite the clear benefits, implementing carbon emission analytics presents challenges, including inconsistent data, fragmented systems, and complex integration with emission frameworks. However, these obstacles can be overcome with the right tools and approaches.
Inconsistent Data
Different units, formats, and update frequencies can create conflicting and noisy data for companies operating multiple facilities. However, utilizing analytics engineering tools like dbt can help standardize, clean, and transform raw data into accurate reporting layers. The end result is faster decisions and cleaner insights.
Fragmented Systems
Thanks to ERP platforms, legacy spreadsheets, SCADA systems, and IoT sensors, emission data can often be scattered across departments. Data fragmentation could make it impossible to have a clear picture of emissions. The good news is that by using cloud-based data warehouses like Snowflake, along with integration tools like Airbyte and Fivetran, organizations can effectively centralize and sync their real-time data feeds.
Integration with Emission Frameworks
Aligning data with evolving emission standards is crucial but time-consuming if done manually. Emission analytics platforms embed regulatory logic to automatically tag data, flag discrepancies, and ensure compliance with frameworks like the GHG Protocol and CDP. This automation reduces manual work, lowers costs, and supports accurate sustainability reporting.
AI and Advanced Analytics in Sustainability
Artificial intelligence and advanced analytics are revolutionizing sustainability efforts by enabling more precise forecasting, automating carbon reduction decisions, and uncovering complex emission patterns. These technologies go beyond traditional tools by analyzing market trends, historical usage, and weather data to accurately predict energy demand and emissions.
Machine learning models empower organizations to accelerate their sustainability goals, manage scope 3 emissions across supply chains, identify sustainable suppliers, and optimize procurement processes. Assessing and managing carbon risks at the organization level is crucial for effective climate action, as it enables companies to understand and reduce their greenhouse gas emissions more strategically. By integrating AI-driven insights, companies can enhance transparency, demonstrate progress to external stakeholders, and secure a competitive industry advantage.
In today’s world, monitoring carbon emissions is no longer optional—it is an essential component of responsible business operations. By leveraging carbon analytics, energy companies can effectively measure and manage their greenhouse gas emissions, support their sustainability reporting, and take meaningful steps toward a net-zero future. However, data alone is insufficient; organizations must transform insights into actionable strategies that drive continuous improvement and environmental stewardship.
Conclusion
In our modern world, monitoring carbon emissions is no longer optional; it’s absolutely essential. As we’ve seen, data plays a crucial role in empowering the energy sector to track emissions effectively, make informed strategic choices, and uncover high-impact opportunities. However, it’s important to remember that data alone won’t cut it. Companies must leverage these insights and turn them into real, actionable steps.
Frequently Asked Questions
Why is tracking carbon emissions so crucial in the energy sector?
The energy sector is a leading contributor to greenhouse gas emissions. Tracking carbon emissions helps companies comply with regulatory requirements, identify emission sources, and develop targeted carbon reduction strategies aligned with science-based targets and sustainability goals.
How do predictive analytics help minimize emissions?
Predictive analytics use machine learning and historical data to forecast emission trends and detect potential issues. This foresight allows organizations to proactively manage operations, optimize energy use, and avoid regulatory risks.
What data types are used in emission analytics?
Emission analytics rely on diverse data types, including operational data, supply chain and logistics information, environmental monitoring, and compliance records. Integrating these datasets supports comprehensive carbon accounting and sustainability reporting.


