This guide covers dbt (data build tool), the open-source SQL transformation framework used by analytics engineering teams — not to be confused with DBT, the therapeutic method. If you’re here for data warehouse modeling, read on.
If your data warehouse is slow to query and your reports take hours to assemble, the problem usually isn’t the platform. It’s the model underneath it.
Most warehouses start life as a copy of a transactional database — the same normalized tables, the same application-shaped schema, now running analytical queries it was never designed to serve. Dashboards crawl. Compute costs climb. Two teams pull the same report and get different numbers.
Dimensional modeling is the fix. Instead of replicating your source schema, you restructure it around fact tables — the measurable events like orders, claims, or payments — and dimension tables that give those facts context: customer, product, region, date. Fewer joins, faster queries, and a structure a business user can actually read.
dbt (data build tool) is how you build and maintain that transformation layer in SQL. It turns your modeling logic into version-controlled, testable code that runs inside your warehouse — Snowflake, BigQuery, Redshift, SingleStore, or Postgres.
This guide walks through designing dimension and fact tables with dbt, from declaring grain to generating surrogate keys.
What Is dbt (Data Build Tool)?
Dbt, short for Data Build Tool, is an open-source command-line tool that helps you transform raw data into analytics-ready data sets. It works by creating a structured and repeatable process for ETL and data modeling. In other words, dbt helps transform data into valuable insights.
Without a structured approach, raw data quickly becomes a liability instead of an asset; DBT ensures it remains usable and insightful.
Ovais, Analyst Engineer, Data-Sleek
However, Suppose you have a lot of data and need to make sense of it. You may need to extract, transform, and load (ETL) it, then perform some analysis on it. This process can be cumbersome and error-prone if done manually, but that’s where DBT comes in.
Additionally, DBT has gained such popularity in the analytic industry that a new position has been created called Analyst Engineer.
Key Features of dbt for Data Warehouse Teams
- Transformation Management: With dbt, you can easily manage your data transformations. It provides a modular approach to defining your transformations, making them easier to manage and maintain. You can organize your transformations into logical units, called “models,” and use SQL to define each model’s transformation logic.
- Version Control: It integrates with version control systems like Git, which allows you to track changes to your data models over time. You can use Git to review changes, roll back to previous versions, and collaborate with other team members.
- Testing: Testing your data is important to ensure accuracy and consistency. Dbt makes it easy to write tests to validate your data models. You can write tests using SQL and run them automatically as part of your deployment pipeline.
- Documentation: It also includes a built-in documentation system that generates documentation for your data models, including data lineage. The documentation is automatically generated based on your SQL code, making it easy to keep your documentation up to date.
- Deployment: dbt makes it easy to deploy your data models to production. It includes features like incremental deployment and dependency tracking, which ensure that your data models are deployed in the correct order and without disrupting other systems.
Transform Your Data Workflow with dbt: Request a Free Consultation with Data Sleek and Let Our Experts Guide You in Leveraging dbt for Deeper Business Insights
Dimensional Modeling With dbt (Data Build Tool)
Dimensional data modeling is a technique used to organize data in a data warehouse efficiently, including data warehousing in Finance. It involves creating Dimension and Fact tables optimized for faster data retrieval. The primary goal of dimensional modeling is to reduce data redundancy, simplify analytical queries, and improve performance.
To understand data dimensional modeling, you need to be familiar with fact and dimension models. A dimension is a descriptive attribute of the business, such as products, customers, order items, and departments. Conversely, a fact is a transaction that links to the dimensions through foreign keys. Examples of facts can include order details, sales revenue, and quantities sold.
To implement data dimensional modeling, you must create dimension and fact tables optimized for efficient data retrieval. Dimension tables contain the descriptive attributes of the business, while fact tables contain the transactional data. The structure of dimensional models allows for easy aggregation and summarization of data, making it easier to generate reports and improve performance.
Designing Dimension Models With dbt
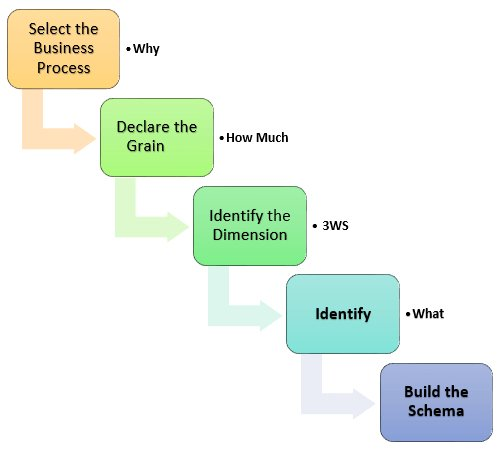
Cool. Let’s take a moment to visualize it. When it comes to designing a dimensional model can seem overwhelming at first. But don’t worry; it’s a process that can be broken down into key steps. Here’s how to approach it:
Select the Business Process to Analyze
To begin, you need to identify the business process or area of focus that you want to model. This could be anything from sales transactions to website clickstream data.
Declare the Grain
After that, the grain is the level of detail at which you want to capture the data. This is a critical decision because it will impact how you structure your tables and aggregate data.
For example, if you’re modeling sales transactions, you could capture data at the product and store level. In this case, your grain would be “product by store.”
Identify the Dimensions Dimensions
The descriptive attributes provide context for the facts. For example, if you’re modeling sales transactions, some possible dimensions include the date, product, store, and customer. It is essential to select dimensions that add value to your model and are relevant to its purpose.
Identify the Facts
In the next step, Facts are the measurable events that you want to analyze. Some possible facts in our sales transaction example include quantity sold, revenue, and cost. It’s important to choose facts that align with your business goals and help answer the questions you’re trying to address.
When deciding whether something should be a fact or a dimension, think about whether it’s something you want to measure (fact) or something that provides context for the measurement (dimension).
As for whether you should keep fact and dimension tables separate or create wide, joined tables, it depends on the complexity of your model and your organization’s specific needs.
Generally, it’s a good idea to keep fact and dimension tables separate for scalability and maintainability reasons, but there may be cases where it makes sense to denormalize your model and create wider tables.
Examples: Building Dimension Tables With dbt
For example, suppose you have a fact table that contains sales data. In that case, a dimension table could be a product table that provides additional information about the products being sold, such as the product name, category, and price.
To create a dimension in dbt, you’ll need to follow these steps:
- Define the dimension: Start by defining the dimension you want to create, including the name and any attributes you want to include. You can create a new dbt model file in your dbt project and specify the dimensions you want to have.
- Build the SQL code: Once you have defined your dimension, you’ll need to write the SQL code to create it. This will involve selecting the relevant data from your source tables and transforming it as necessary to make the dimension table.
- Test the code: Before loading the dimension table into your data warehouse, you’ll want to test the SQL code to ensure it works as expected. You can run the code in a SQL editor or IDE and check the output.
- Load the dimension table: Finally, you’ll load the dimension table into your data warehouse. This can be done by running the dbt run command, which will execute all the models in your dbt project and load the results into your data warehouse.
To make this process more efficient, there are a few best practices you can follow:
- Use dbt macros: It includes a number of built-in macros that can help you to write more efficient and reusable code. For example, the ref() macro can reference other dbt models in your project, allowing you to build more complex transformations more easily.
- Use incremental models: If your source data is large, rebuilding your entire dimension table may only be practical sometimes you run dbt. In this case, you can use an incremental model only to update the changed rows since the last run.
- Document your code: As your dbt project grows in size and complexity, it’s essential to document your code so that others can understand what it does and how to use it. dbt allows you to add documentation to your models using comments, which will be displayed on the dbt documentation site.
Example :
Here’s an example of how you might use dbt to create a dimension for product data:
- Define the dimension in a SQL file: Create a new SQL file in your dbt project’s models directory and define the dimension using SQL code. For example, you might create a file called product_dim.sql and write SQL code to define the product dimension table. The code might look something like this:
SELECT
product_id,
product_name,
category,
subcategory
FROM source_data.products
This code would select the relevant attributes from a source table (in this case, source_data.products) and create a new table with those attributes.
- Use dbt to compile the SQL file: Once you’ve defined the dimension in a SQL file, you can use dbt to compile it into a SQL script that can be run against your database. To do this, you would run the following command in your terminal:
dbt compileThis would compile all of the SQL files in your dbt project’s models directory into a single SQL script.
- Use dbt to run the SQL script: After you’ve compiled the SQL script, you can use dbt to run it against your database. To do this, you would run the following command:
dbt runThis would execute the SQL script against your database and create the dimension table.
Using Dimensions In The Analysis
This means grouping data based on specific categories or attributes, such as customers, products, time, or geographic location. Doing so allows you to analyze the data from different perspectives and gain insights into patterns, trends, and relationships.
How You Can Use Dimensions To Look At Data In A Data Warehouse.
Imagine you’re a data analyst for a retail company, and your job is to make sense of the vast amounts of data your company generates daily. You’re tasked with creating reports and visualizations to help your data team make better decisions, but you need help with the sheer volume and complexity of the data. That’s where dimensional modeling comes in.
Here are some steps to help you understand how dimensions can be used to analyze data in a data warehouse:
- Identify the dimensions of your data: Start by looking at the data you want to analyze and identifying the dimensions that apply to it. For example, if you are analyzing sales data, some relevant dimensions include time, location, product, and customer.
- Create a dimension table: Once you have identified the relevant dimensions, you can create it that stores all the attribute values for each dimension. For example, a time dimension table might include columns for year, quarter, month, day, etc.
- Link the dimension table to your fact table: The fact table contains the numeric data you want to analyze, such as sales revenue or website traffic. You can use the dimension attributes to slice and dice the data in different ways by linking the fact table to the dimension table.
- Write queries using dimensions: With the dimension table linked to your fact table, you can write queries that use the dimension attributes to analyze the data. For example, you could calculate revenue by the customer by joining the sales fact table with the customer dimension table and grouping the results by customer.
By using dimensions in your analysis, you can better understand your data and make informed decisions based on insights.
Useful dbt Data Modeling Techniques
You’ve heard the saying, “A database won’t run itself.” That’s why having a few dbt modeling tricks up your sleeve can come in handy to help you get the most out of your database. Here are five dbt modeling tricks that can make your process easier:
- DBT Snapshot: dbt snapshots are an easy way to implement type-2, slowly changing dimensions. This allows you to keep track of changes made to your data over time. You can add columns such as dbt_valid_from and dbt_valid_to to your rows. By setting dbt_valid_to to null, you can track the latest version of the row. However, it’s important to note that snapshots are only updated when they’re run, so use additional monitoring solutions, such as an audit database, to capture all changes.
- Surrogate Key: The dbt-utils package includes a macro that generates a primary key for your data. This is useful for creating dbt tests for unique primary keys and when using the model in a BI tool like Looker, which requires the primary key to be specifically defined to perform aggregations correctly. (dbt utils surrogate key)
- Pivot: The dbt-utils package also includes a pivot macro that you can use to segment totals for further analysis. This is often useful when creating cohort views of product sales to look at month-to-month performance. (dbt utils pivot)
- Tests: dbt includes four generic tests that can help ensure data integrity. These tests include unique, not_null, accepted_values, and relationship tests. You can quickly implement these tests in your project yaml files, and they will be checked alongside the data model each time it’s run. It’s important to note that dbt models won’t be built if a dbt test fails, so setting the test severity appropriately is essential.
How Data-Sleek Helps You Start With dbt
As we mentioned earlier, It’s a powerful and versatile tool that could transform the way you use data in your business. And the best part? DataSleek’s experts can help you get started with it.
Our team has years of expertise that we can share with you to help you avoid pitfalls and make the most of DBT. Imagine having the ability to transform data for daily, hourly, and even minute-by-minute metrics. That’s what we recently did for some of our clients using GitHub actions triggering DBT for SingleStore. We applied the same dimensional modeling discipline for Johns Hopkins University’s fundraising analytics team, cutting report delivery time from 24+ hours to under 1 hour — see how in our Johns Hopkins University case study. We can do the same for you!
Now, you might be thinking, “But I’m not a tech expert. Can I still use DBT?” Absolutely! DBT is designed to be easy to use and navigate, even for analysts with basic SQL skills. We can help you with data modeling and show you plenty of other examples where DBT shines.
Here’s another thing to consider: DBT is open-source, which means you can use it for free. However, there are trade-offs between the paid and free version.
With the paid, cloud version, you get access to data lineage, a type of data tracking that’s incredibly useful for companies that compile data from multiple sources.
You also get to use reusable macros, which are code templates that you can use again and again. Plus, DBT has built-in testing for all your models.
But don’t worry, we won’t leave you hanging. DataSleek expert consultants can help you understand the best way to use DBT for your business. Whether you choose to use DBT Cloud or triggers in Airflow, we can guide you every step of the way.
Final Thoughts
So there you have it. By using DBT to bring dimensions to your data, you can gain insight into your data’s hidden relationships and structure. This is critical for any organization that values transparency and accuracy when handling data.
Now , You can make smart decisions based on sound science and effective organizational practices. Whether you are a data engineer or data analysts looking to uncover new insights, DBT provides powerful tools for understanding the connections in your data and drawing meaningful conclusions from the facts at hand.
Ready for a consultation? Contact Us Now


