For most retailers, the goal is to achieve sales like Black Friday/Cyber Monday (BCFM) season all year long. Increasing sales are only a fraction of the benefits of implementing a sound retail data analytics framework into your business. Today, we’re taking a deep dive into analytics to help your organization go from red to black quicker, faster, and easier.

What Are Retail Analytics?
Ah, the magic of the holidays–the smell of tempting treats wafting through the air, the hustle and bustle of preparing for festivities with friends and family, and of course, store windows decked out in their finery, displaying their most beautiful wares amidst tulle snowscapes and twinkling white lights. Who hasn’t gone out with the harmless intention of enjoying these comely scenes without spending any money, only to be ensnared by the siren song of the stores’ beckoning?
Lo and behold, before you know it, you’ve procured your wallet from your coat pocket and are making a purchase, despite your protestations that you were only doing a bit of benign window shopping. How does it happen? How do retailers always seem to know exactly what we want and are inclined to purchase, even before we do? It’s not luck nor clairvoyance. The secret is predictive retail analytics.
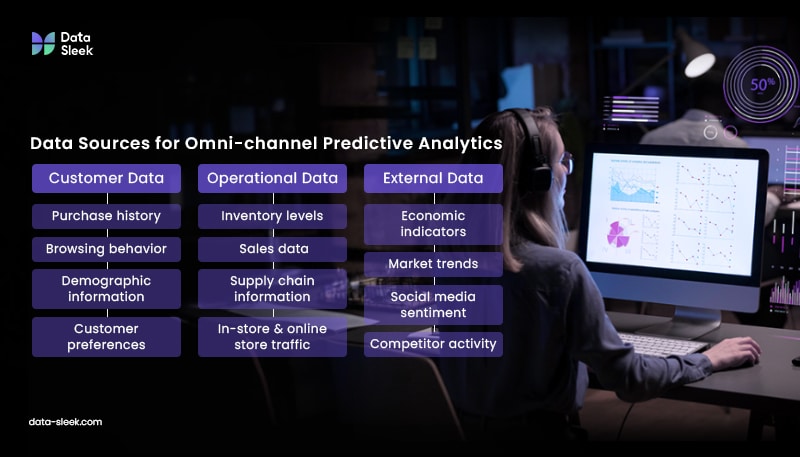
In order to maximize profit, minimize loss, and optimize inventory stocking, retailers rely on a wide variety of data types. Each provides unique insights into their customers, sales trends, and marketing effectiveness. Another bonus: predictive analytics don’t discriminate by sales platform in their ability to enhance sales. Brick and mortar shops, straight e-commerce retailers, and their hybrid, omnichannel shopping, all benefit from the business intelligence afforded by analytics. For context, here are the differences between the platforms.
Brick-and-mortar stores are the traditional retailers we think of when we picture a trip to the mall. While they have to support higher overhead, maintenance and insurance costs, they offer something that the digital world cannot: a humanized, tactile, and social shopping experience.

E-commerce platforms offer convenience and personalization. What these retailers offer in mobile convenience, they lack in payment flexibility. Unlike physical stores, they cannot accept payment by cash or smartphone, only digital payment.
Omnichannel retailers have the best of both worlds. They integrate online and offline shopping experiences to create a consistent customer experience across all platforms, earning the nickname “bricks-and-clicks” retailers. Omnichannel businesses can use personalized marketing, data synchronization, and in-store kiosks to display online inventory.
Types of Data Analytics in Retail
Transactional Data
Transactional data is one important component of the entire data picture. This crucial data contains detailed records of each sale or purchase, capturing information like which items were bought, the quantities, prices, discounts, time of purchase, and payment method. All this information is usually generated at the point of sale (POS) and is one of the richest sources of information for retailers. All that information-dense data is that’s collected at the time of purchase includes nuggets like:
- Product SKUs, quantity purchased, and price
- Timestamp of the purchase
- Payment method (e.g., credit card, cash, digital wallet like ApplePay).
- Purchase frequency and order history
Transactional data helps retailers gain a clear view of customer behavior and product performance by capturing each sale’s details—like items bought, quantities, and prices. This data lets retailers understand customer preferences, identify top-selling products, and spot seasonal trends. By analyzing transactional data, they can accurately forecast demand, streamline inventory management, and reduce stockouts or excess stock. Additionally, it allows them to measure the effectiveness of promotions and personalize marketing efforts. In essence, transactional data equips retailers with insights that drive better decision-making, improve customer targeting, and boost overall sales and efficiency.
Transactional data helps retailers gain deep insights into customer preferences, sales trends, and inventory needs. Predicting customer demands provides valuable utility for retailers. Predictive transactional data has turned this forecasting from an educated guess based on historical trends to an exact science, and the proof is on the ledger: analyzing transactional data can improve demand forecasting by up to 50%, reducing stockouts and excess inventory. Using AI and machine learning to generate predictive analytics can predict retail sales with 95% accuracy during peak seasons, showing how consumer interest precedes and accurately forecasts demand.
It also helps target promotions more effectively; research shows that personalized promotions can increase sales by 10-15%. Plus, with a clear view of purchase patterns, retailers can improve customer retention by up to 25% by tailoring offers to specific segments. Overall, this data allows retailers to boost profitability and operational efficiency by optimizing inventory, enhancing customer engagement, and fine-tuning marketing efforts.

Customer Behavior Data
Customer Behavior Data helps retailers understand how customers interact with their store or website. Even some innocuous window browsing is included in that data, even if there is no purchase. Analyzing how customers behave allows retailers to predict future sales trends, optimize inventory, and personalize marketing efforts based on past interactions.
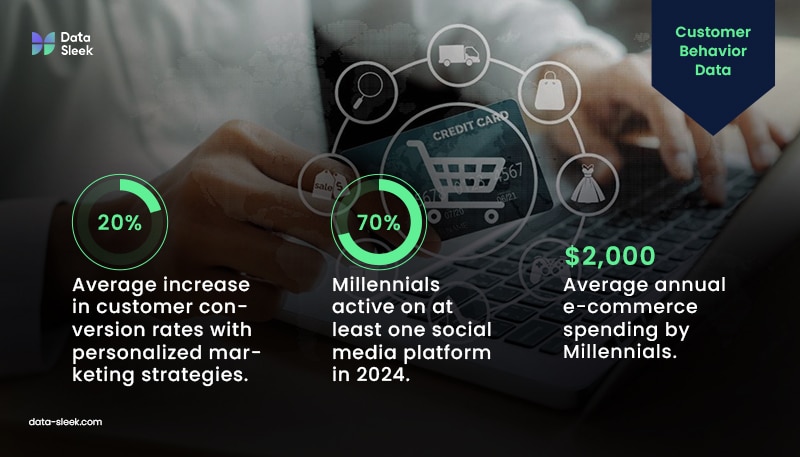
On top of boosting retention rates by up to 10% through targeted loyalty programs, insights from customer behavior give useful direction for marketing strategies. Personalized marketing strategies have been shown to elevate customer conversion rates by up to 20%, on average. By understanding when, why, and how often customers make purchases, retailers can also improve value per transaction as well as overall retention rates. When retailers collect customer behavior data, they’re pulling from sources like:
- Pages viewed
- Items clicked
- How much time was spent on different sections of the website or app
- Abandoned cart items, which demonstrate interest but no purchase
- In-store foot traffic patterns and “dwell time” in specific areas (from sensors or cameras)
- Past purchase behaviors, like preferred product categories or seasonal buys
Mining social media platforms for customer data provides insights into customers’ opinions, engagement, and interactions with the brand online. It also helps retailers target specific demographics, including those with the strongest influence on social platforms, and groups most likely to be amenable to social media marketing.
Maybe because they were the first generation to use it, Millennials are the most active demographic on social media, with about 70% of them reporting activity on at least one social platform in 2024. Despite having lower average incomes than older adults, Millennials remain staunchly in the lead for biggest online spenders, spending around $2,000 annually on e-commerce platforms. By making good use of all the time and money these younger adults spend online already, retailers can predict spending trends and demands by analyzing:
- Likes, shares, comments, and mentions on posts
- Hashtags associated with the brand or products
- Sentiment analysis from comments or reviews
- Influencer engagement metrics, such as follower demographics and engagement rate
Marketing and Advertising Data
Retailers also mine data from marketing and advertising campaigns, which can be a particularly useful way to ascertain which strategies are driving sales and which strategies can be canned.
Critical data can be gleaned from:
- Click-through rates (CTR) and conversion rates from email marketing campaigns.
- Ad performance data across different channels (PPC, social media ads, display ads)
- Customer segments targeted by campaigns and the resulting engagement
- The overall reach of the campaign (how many intended customers were exposed), frequency of exposure, and impressions
Predictive analytics give retailers the power to use data from past campaigns. This historical data can be measured against current marketing strategy numbers. By collating metrics on buying patterns and customer interactions, predictive models can help retailers identify which promotions resonate most with different customer segments.
Demographic Data
Ever been shopping on vacation and wondered why the same department store chain you visit at home all the time has wildly different inventory than you’ve seen at your neighborhood location? Chalk it up to demographic data analytics. Retailers use demographic data like age, gender, location, income, and lifestyle preferences because it’s teeming with compelling insights that help fuel predictive analytics and optimize sales.
Retailers would be foolish not to exploit this data. It’s one of the most effective ways to tailor products, promotions, and inventory to match customer needs. Understanding demographics allows retailers to segment their audience and predict purchasing behavior within each group, increasing campaign efficiency. And using this data can pay off in spades. Personalized marketing based on demographics has the potential to increase response rates by a mammoth 50%.

Insights into Inventory Data
It makes sense that demographic-driven predictive models are an accurate driver of inventory.
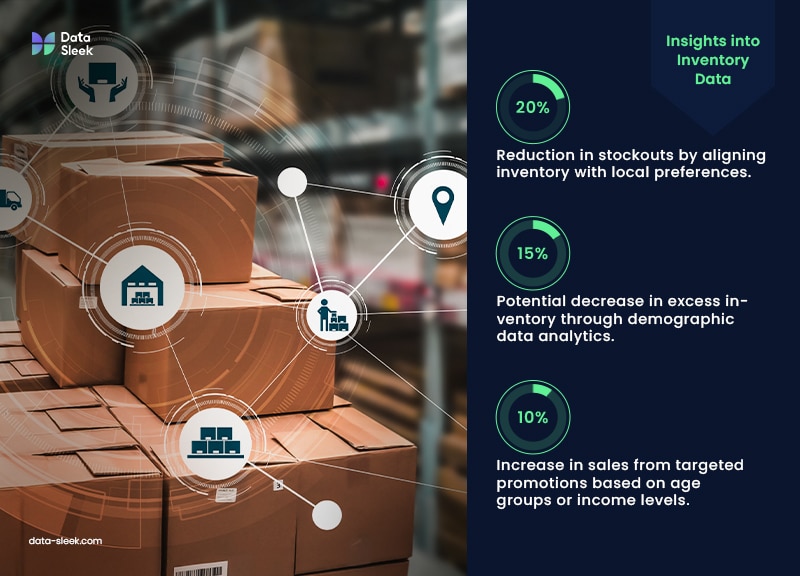
- By aligning inventory with local preferences, retailers can reduce stockouts by 20%
- Demographic data analytics can reduce resource-wasting excess inventory by up to 15%
- Knowing which age groups or income levels are more likely to buy certain products enables retailers to create targeted promotions, which can boost sales by up to 10%.
This approach makes demographic data an invaluable asset for forecasting demand, tailoring marketing strategies, and optimizing stock management.
Creating a Composite View of Commerce
Since the best predictor of future behavior is past behavior, retailers know that culling data from past trends can help clear the retail fog and forge a path for future decisions. And clarity equals cash flow. Retailers who use advanced demand forecasting techniques, often powered by AI, see inventory savings of 20-50% and an increase in sales of 10% on average .
Descriptive analytics forms the foundation of retail data analysis by providing a clear and concise summary of historical data. Whether a marketing campaign resulted in a spike in consumer activity, or a business experienced a lull in sales despite promoting loyalty programs and incentives, data analytics can answer the question, “what happened?” by looking at past sales data, customer demographics, and other relevant metrics.
Data scientists have developed a multitude of techniques to turn raw data into meaningful insights. Using data aggregation and summary statistics, descriptive analytics transforms raw data into business insights that can be easily interpreted and visualized. This allows retailers to identify trends, patterns, and anomalies in their sales data, and get a keen understanding into what it is their customers want.
Using Descriptive Analytics To Your Advantage
Descriptive analytics can help identify the best-selling products, peak shopping seasons, and preferred customer segments. These insights can then inform inventory management, marketing campaigns, and overall business strategies. This proactive approach reduces costs, enhances customer satisfaction, and helps retailers optimize operations, making predictive analytics a key driver of efficient, data-driven retail strategy.
For retailers, the best predictor of profits and losses is understanding demand. Marketing departments need to be able to forecast which loyalty programs are having their intended effect, and which marketing campaigns are leaving consumers cold. Business owners are best able to maximize the benefits of predictive analytics by integrating business intelligence tools. Optimizing sales can require some clever data manipulation. Often, retailers are squeamish about using data analytics tools because of the intimidation factor. To be fair, some BI tools require slightly more technical expertise, which is where a consultation with a Data-Sleek expert will get you on your way to optimizing business decisions.
So how do you know which BI tools to use in order to get the most out of your raw data? Let’s break down some of the specifics.

Tools of the (Most Profitable) Trades
Google Analytics
Google Analytics is a web analytics tool that tracks website traffic, user behavior, and online performance.
- Because its strength lies in monitoring and optimizing digital marketing efforts, it’s a must-have for e-commerce retailers.
- It tracks online traffic sources, conversion rates (how many visitors to the site take action favorable to the retailer), and user behavior, giving retailers a deep understanding of how customers interact with their websites.
- It allows you to monitor marketing campaigns, adjust strategies, and improve the overall online shopping experience.
Challenge it solves best: Google Analytics is specifically focused on tracking website and app activity. It’s excellent for understanding how users are interacting with a digital platform (such as which pages they visit, how long they stay, or where they drop off). Google Analytics gives insight into customer behavior, conversion rates, and marketing performance, making it perfect for online performance tracking.
Level of Data Expertise Required: Low to Moderate. Google Analytics has a user-friendly interface, so many users can access and interpret basic data, like page views and user demographics, without much training. More advanced features, like custom reports and tracking setup, require some technical knowledge.
Tableau
Tableau is a data visualization tool that specializes in creating clear, detailed dashboards from complex data. Its devotees love it for its user-friendly drag-and-drop interface.
- Tableau is highly visual, which makes it easy for retailers to create custom dashboards and spot trends in real-time
- Dashboards that are customized just for your retail business allow you to identify and immediately pivot your sales strategy for things like inventory issues or sales spikes.
- It’s especially helpful for retailers that want to dive deep into customer and sales data and share insights across teams.
Challenge it solves best: Tableau is perfect for visualizing data in charts, graphs, and dashboards. It’s ideal for turning data into a visual story that makes it easier to see patterns, trends, and insights. Tableau is used by businesses to create reports and dashboards that give an at-a-glance view of business metrics.
Level of Data Expertise Required: Low to Moderate. Tableau is designed to be user-friendly, so many users can build charts and dashboards without deep data knowledge. However, some understanding of data structure (like rows, columns, and filters) is helpful for getting the most out of Tableau.
DBT Labs
With impressive data transformation and modeling capabilities, Data Build Tool helps retailers make the most of predictive analytics by turning raw data into usable, structured insights.
- Retailers can transform large volumes of raw data from sources like point-of-sale systems, customer interactions, and inventory levels into clean, consistent datasets
- This organized data enables advanced analytics models, allowing retailers to forecast demand, personalize marketing, and optimize inventory
- Retailers using DBT have seen faster, more accurate insights, with up to 50% reduced time in data preparation
- DBT is open-source and compiles directly into transparent SQL, so it’s easy to read and interpret
Challenge it solves best: DBT Labs focuses on transforming raw data into clean, structured formats. It’s a crucial step for companies needing to prepare their data for analysis by “cleaning” it and structuring it so that platforms like Snowflake or Tableau can use it efficiently. DBT helps ensure that data is accurate and easy to work with.
Level of Data Expertise Required: Moderate to High. DBT users need to understand data transformation concepts and be comfortable with SQL and data modeling. DBT is more for data analysts or engineers who prepare data for others in the organization to analyze.
SingleStore
Singlestore is a database platform that is perfect for businesses that need to see their analytics in real time. Singlestore delivers by processing and analyzing data instantly as it’s generated by incoming consumer information.
- When customers make purchases, SingleStore can immediately analyze that transaction data along with inventory levels, customer profiles, and online activity.
- This instant analysis allows retailers to see current demand, track inventory, and respond to trends as they happen—like offering promotions on high-demand items or restocking popular products before they run out.
- Because of its lightning-fast turnaround time, retailers get up-to-the-minute insights that help them make fast, data-driven decisions to maximize sales and improve customer satisfaction
Challenge it solves best: SingleStore is best for real-time analytics as it can instantly process and analyze data as it’s created. It’s ideal for businesses that need to make immediate decisions, like monitoring live sales or tracking inventory levels. It’s optimized for cases where low-latency (minimal delay) analytics are critical. Retailers love it for its speed in data ingest, transaction and query processing, and user-friendly interface.
Level of Data Expertise Required: Moderate to High. Since SingleStore deals with both fast, transactional data and analytics, users need to understand data management well, and ideally, be comfortable with writing SQL queries and understanding how data flows through a system.
Snowflake
Like SingleStore, Snowflake is also a cloud-based platform that helps retailers produce predictive analytics.
- Snowflake doesn’t offer the same instantaneous “low-latency” processing, but its optimized for large-scale, complex analytical workloads.
- It excels in handling huge data volumes, batch processing, and BI analytics
- It allows retailers to bring together disparate data sources like transaction history and social media trends and then run advanced analytics and machine learning models
- Great forecasting demand, personalized recommendations, and optimized stock levels
Snowflake’s scalability is where it shines. It allows for quick, complex computations, helping retailers predict future sales trends and adjust strategies on the fly. Using Snowflake improves forecast accuracy, reduces stockouts, and enhances customer engagement, which drives more sales and increases customer loyalty.
Challenge it solves best: Snowflake is excellent for managing and analyzing very large amounts of data. It’s designed for businesses needing to store data from many sources (like sales, marketing, and inventory) and analyze it all in one place. Snowflake helps with big-picture analytics, trends over time, and understanding data across a company.

Predict, Prepare, and Prosper: How Retailers Depend on Data Analytics in Emergencies
It seems that every time we experience a natural disaster, those of us who aren’t directly affected by the tragedy throw up our hands in the immediate aftermath, despondent and helpless: why is aid so slow to get to the victims?
Rather than throw culpability at our governments or those working tirelessly to aid those in need, it’s important to understand the root cause of disaster relief delays: logistic issues. When Hurricane Sandy devastated much of the northeast of the United States in October of 2012, one retail behemoth put predictive analytics to work to mitigate inventory issues, keep supply chains running, and make sure they didn’t lose profit in the interim.
Before the storm hit, Walmart put BI tools to work to parse historical sales data, weather forecasts, and demographic data to predict demand spikes for specific products. Those data tables created a cascade of proactive logistics effects, and inventory for items like flashlights, bottled water, and batteries were automatically calibrated based on past storm trends.
By analyzing patterns from previous storms, Walmart’s predictive models were able to forecast exactly which items would be in higher demand and sent those products to stores in the affected areas ahead of time.
Other retail locations have since followed suit. Walmart’s anticipatory use of data analytics to get disaster victims the items they need was revelatory for retail businesses, omnichannel and brick-and-mortar alike.
Fortunately, there’s no need to wait for a disaster. This forecasting strategy is hyper-effective in ensuring stores are well-stocked with the items customers need most, minimizing stockouts, and maximizing sales during peak demand. Minimizing stockout as well as overstock reduction are two sides of the same coin, but they both cost retailers serious coin–a retailer generating $50 million a year in sales can save about $10 million a year by avoiding stockout. Combining stockout costs with overstock costs, a retailer with $100 million in total inventory can save about $20 million each year through advanced analytics.
Data Predictions for Dynamic Pricing
Even if leisurely browsing the storefront displays sounds like an idyllic way to while away an afternoon, let’s be realistic. Many of us are doing the majority of our shopping on our laptops or, increasingly, our smartphones. Because we’re all on the internet, all the time, retailers must have the ability to pivot on pricing, or risk losing sales to competition. Predictive data analytics allows retailers to make smart decisions about pricing by analyzing factors like demand, seasonality, and competitor prices.
Understanding Demand Patterns: Analytics can show when certain products are more in demand (like umbrellas during a rainy season or grills before summer). By predicting these patterns, retailers can adjust prices accordingly. If demand is high, prices might go up slightly; if demand is low, prices could drop to attract more buyers.
Seasonal Adjustments: Retailers know some products sell better at specific times of the year, like holiday decorations in December or back-to-school supplies in August. Knowing when and by how much to adjust pricing can increase a retailer’s gross margin by 5-10%. With predictive analytics, they can price items higher during peak times or slash prices to clear stock at the end of a season.
Reacting to Competitor Prices: Retailers can also track competitor pricing and use analytics to stay competitive. If a competitor lowers prices on a product, predictive analytics can suggest a similar discount to prevent losing customers or identify a unique value (like free shipping) to keep pricing competitive.
Think about this: 72% of adults in North America use their smartphone to research price comparisons while shopping in-store, making it the primary type of research done on mobile devices in-store, as of 2023.
It’s also pretty common for consumers to combine the digital and physical shopping experience. Almost 40% of US and UK adults research products on a retailer’s website and purchase in-store.
By using these insights, retailers can set up dynamic pricing, where prices automatically adjust in real-time based on what’s happening in the market. This allows them to optimize sales, avoid excess inventory, and keep customers happy with prices that reflect current conditions.

Taking the Plunge into Predictive Analytics
Change is daunting. We are creatures of habit. But when sticking with the status quo is keeping your business at a standstill while your competition blows past you, embracing new technology and better strategies becomes a necessity. Before data scientists were able to harness the potency of predictive analytics for retail applications, retailers relied on outmoded channels to make business decisions. Industry reports, market research, competitor analysis and focus groups are fine, but with the ability to predict consumer trends using historical data, why not use every tool at your disposal? So what’s the best way to diagnose the data health of your business to determine whether you’re ready to use data analytics? Thinking about a few questions can be a helpful barometer.
As a retailer, you’re ready to use predictive analytics when you have the basic infrastructure in place to make the process smooth and effective.
- First, you need to be scalable—meaning you can handle growing amounts of data and more complex tools as their needs grow.
- Good data quality and availability are also essential; having clean, reliable data from various sources (like sales, inventory, and customer interactions) that’s accessible is crucial. This is where a BI tool like DBT can be valuable.
- Finally, strong system integration is key, so different software and databases can “talk” to each other, making it easier to collect and analyze data from all parts of the business. When these pieces are in place, your retail business is well-positioned to use predictive analytics to make smarter, data-driven decisions.
Whether your goals are to optimize sales, engage more effectively with consumers, streamline inventory, convert starry-eyed window shoppers into satisfied customers, or all of the above, a complimentary consultation with a Data-Sleek® expert is the first step. Contact us today to let predictive analytics go to work for your business.


