Black Friday isn’t just a shopping frenzy—it’s a data goldmine. This is the moment when savvy businesses turn numbers into profits faster than a checkout line at midnight. It’s a data-driven race to the top, and the winners are those who are effectively using business intelligence tools for their retail data management and know how to transform the madness into a well-oiled machine of insights and action.
Black Friday, A.K.A. the “Retail Sales Super Bowl”
Whether or not the reputation is deserved, Americans are known for being particularly enthusiastic about a few things: namely, food, shopping, and sports. So what activity could be more authentically American than waking up the morning after the biggest synchronized eating marathon in the nation to go scouring for good deals? Behold: Black Friday.
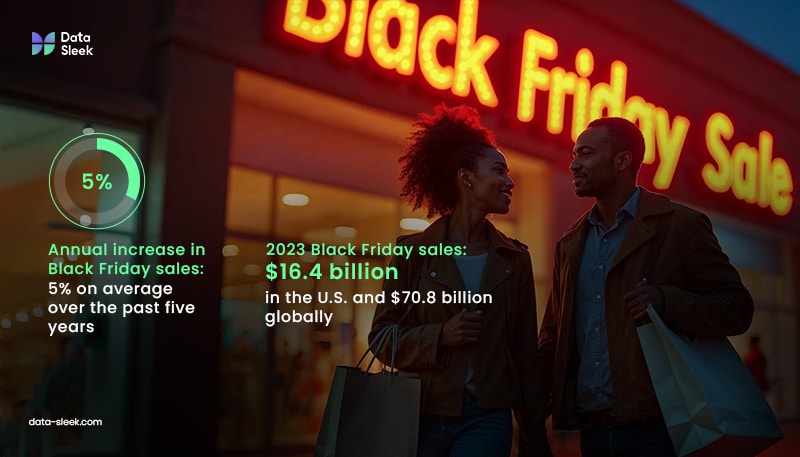
To put it in sports terms, another of America’s great passions, Black Friday is like the Super Bowl of sales for retailers—it’s thrilling, chaotic, slightly masochistic, and packed with potential. Considering that for the last five years, total U.S. retail sales on Black Friday increased an average of 5%, year-over-year, reaching $16.4 billion in the United States and $70.8 billion worldwide in 2023 on one day alone, the import of the day couldn’t be more significant to retailers.
Why Omnichannel Retailers Are Winning the Black Friday Game
For omnichannel retailers, the impact of this day could be even greater. For context, an omnichannel retailer is a business that provides a consistent shopping experience across multiple channels, sometimes called “bricks-and-clicks” or the even more precious “click and mortar”. These shopping avenues include in-store, online, and mobile.
Retailers achieve this congruity by allowing customers to interact with the brand across multiple channels, while retaining their information as they move between them. While in-store retail still accounts for the vast majority of sales with 85.2% of retail revenue in the U.S. compared to the 14.8% of that revenue coming from e-commerce sales, the growth trends indicate a shift in afoot. In the last couple of years, in-store Black Friday shopping has increased by a measly 1.1%, while e-commerce boasts a growth rate of 8.5%.
Most of us have partaken in the ritual and know the signs: the physical stores are buzzing, online traffic is surging, and every marketing channel is firing on all cylinders. But behind all the action, the strongest performing retailers aren’t not just winging it—they all have Business Intelligence (BI) tools running the show. BI tools are the applications and software programs that help businesses collect, analyze, and report data to predict trends and make better decisions overall.
Business intelligence tools are invaluable for helping retail companies:
- Understand business performance
- Find new business opportunities
- Make strategic decisions
- Identify patterns and trends
- Improve the workplace environment
Most retailers use an operating budget that presupposes a certain percentage of revenue that relies on Black Friday and its newer cousin, Cyber Monday. The pressure to meet or exceed these dizzying numbers is fierce. By integrating BI tools throughout the year, you can achieve steady, consistent growth. Whether you’re an established brick-and-mortar retailer looking for entrée into the e-commerce arena, or a startup entrepreneur with unlimited growth potential but searching for the best way to achieve your goals, it’s worth taking a closer look at how business intelligence tools can work for you, year-round.
Choosing the Right BI Tool for Your Retail Business
Imagine being able to analyze which products are trending during slower months, or tracking customer segments and fine-tuning your promotions based on real-time data. By continuously learning from customer behavior and optimizing your strategy, you can turn those one-day Black Friday highs into year-round success.
Savvy BI integration turns you into a data-driven sales machine, ready to bring in the crowds any day of the year. To help you decide how best to use BI tools to turn your retail business into a profit powerhouse, it’s helpful to look at the particulars of some commonly used business intelligence tools.
SingleStore
SingleStore is a distributed SQL database built for real-time data analytics. It combines transactional and analytical workloads, enabling businesses to manage and analyze large datasets simultaneously.
- Part of its strength is the ability to handle complex data from multiple sources like CRM systems, eCommerce platforms, and inventory tools, making it perfect for retailers.
- Real-time insights allow retailers to track customer behavior, product performance, and sales trends instantly, optimizing operations and marketing on the fly.
Why we recommend it: SingleStore provides fast, scalable data analytics, making it ideal for retailers managing large datasets in an omnichannel setup. It can integrate data from various sources like your CRM system, eCommerce platforms, and inventory management tools.
Why it’s not for everyone: SingleStore can be complex to maintain, especially if your team lacks the technical skills to manage it. Its higher price point than others makes it a costly option for smaller businesses.
Qlik Sense
Qlik Sense is a self-service data analytics tool that uses AI to help users explore data and create visualizations.
- It’s known for its associative data model, which allows users to explore relationships between data points.
- Qlik Sense can be a boon for retailers who need to track sales across multiple channels and geographic regions
- It provides a high level of interactivity when comparing different data sets.
- It helps identify patterns, like which stores perform best, or which product categories are trending, and offers insights in a highly visual, intuitive, easy-to-read way.
Why we recommend it: QlikSense’s associative model lets users freely explore data and discover hidden connections, which can be key for uncovering cross-channel relationships in retail.
Why it’s not for everyone: Qlik Sense’s associative data model is powerful, but its learning curve can be steep for non-technical users. It’s also lacking some basic functions, like the ability to print out some dashboards and reports.
Google Analytics
Google Analytics is a web analytics tool that tracks website traffic, user behavior, and online performance. It’s a standard for most online retailers of all sizes and comes with advanced customizations to track specialized KPIs.
- Because its strength lies in monitoring and optimizing digital marketing efforts, it’s a must-have for e-commerce retailers.
- It tracks online traffic sources, conversion rates (how many visitors to the site take action favorable to the retailer), and user behavior, giving retailers a deep understanding of how customers interact with their websites.
- It allows you to monitor marketing campaigns, adjust strategies, and improve the overall online shopping experience.
Why we recommend it: Aside from the fact that it’s an industry standard, Google Analytics is tailored to digital marketing and website performance, offering built-in tools to track customer acquisition and behavior on your website.
Why it’s not for everyone: Although it’s absolutely essential for tracking web traffic, it doesn’t provide a comprehensive view of customers for omnichannel retailers. Data extracted from Google Analytics must be treated as a segment separate from in-store customers because of their different behavior. Its reporting flexibility is also limited compared to more advanced BI tools.
Power BI
A creation of the data scholars at Microsoft, Power BI is a business analytics tool that allows users to create interactive reports and dashboards
- It has the capacity to connect to various data sources, like databases, cloud services and spreadsheets
- If you’re a retailer with multiple data systems (POS, inventory, CRM) Power BI is an effective way to organize all your data by integrating all those data sources into one dashboard
- This allows you to track sales, supply chain performance, and customer insights in one place, making it ideal for large retailers who need a comprehensive view of their operations
Why we recommend it: Its integration with Microsoft’s ecosystem (like Excel, Azure, etc.) makes it extremely powerful for the many retail businesses already using those services.
Why it’s not for everyone: Just like there’s polarity between Microsoft and Apple, some users might find Microsoft’s structure difficult to work with. Power BI offers deep integration with Microsoft’s ecosystem, but things run into a problem if your organization doesn’t particularly use Microsoft products. It also can struggle with very large datasets compared to other providers.
Tableau
Tableau is a data visualization tool that specializes in creating clear, detailed dashboards from complex data. Its devotees love it for its user-friendly drag-and-drop interface.
- Tableau is highly visual, which makes it easy for retailers to create custom dashboards and spot trends in real-time
- Dashboards that are customized just for your retail business allow you to identify and immediately pivot your sales strategy for things like inventory issues or sales spikes.
- It’s especially helpful for retailers that want to dive deep into customer and sales data and share insights across teams.
Why we recommend it: Tableau is a leader in advanced data visualization, offering powerful tools to create and share insights visually. Its learning curve is a lot less steep than other providers and it works well integrating with other BI tools.
Why it’s not for everyone: Tableau crushes it when it comes to data visualization, but it can be overkill for companies that don’t need advanced visual analytics. Its user friendliness also comes at a cost. It can be higher than other competitors when scaling across teams.
SAP Business Objects
SAP (Systems, Applications, and Products) Business Objects is a powerhouse BI tool that helps retailers collect, analyze, and share data to optimize business strategies.
- It turns raw data from sales, inventory, and customer behavior into easy-to-understand reports and dashboards.
- SAP Business Objects offers comprehensive capabilities including reporting, analysis, and customizable dashboards.
- It allows retailers to quickly spot trends, track performance, and make informed decisions—like managing stock levels, optimizing pricing, or targeting marketing efforts—to improve overall efficiency and sales
- Similar to Looker, it can create customizable, interactive dashboards that retailers can tailor to their specific needs
Why we recommend it: Though its complexity may be a bit daunting, its advantages and features make it a robust choice for large retail operations seeking in-depth insights and extensive reporting capabilities.
Why it’s not for everyone: SAP Business Objects is a robust BI tool, but its complexity and steep learning curve make it more difficult than necessary to work with. Unless your organization is advanced in the technical side of data, this one isn’t a contender.
TL;DR: Google Analytics is the choice for web-focused retail analysis, while Looker, Qlik Sense, Power BI, SAP Business Objects and Tableau offer broader business intelligence solutions but differ in terms of customization, data exploration, and visualization strengths.
Essential Features of Retail BI Tools
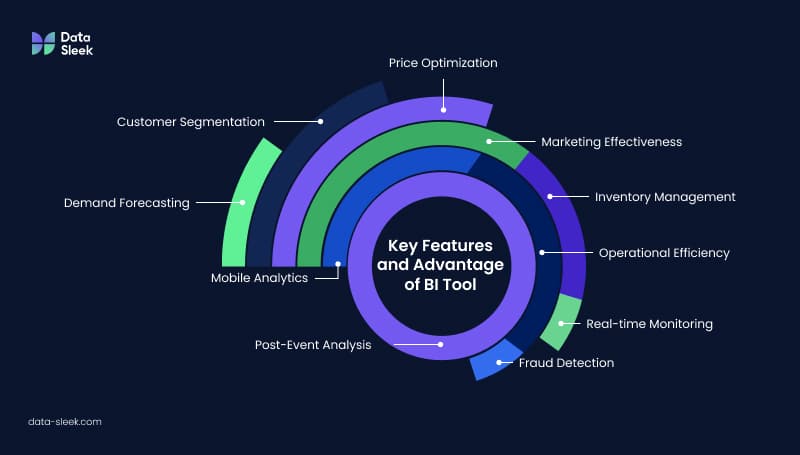
Now that we’ve covered some of the commonly-used tools that help analyze, predict, and generate the best revenue outcomes for retail businesses, it’s helpful to establish the key features of BI tools. What are they designed to accomplish, and how can they work for you?
Key Features and Advantages:
- Demand Forecasting: BI tools can be leveraged to meticulously analyze historical sales data, discover patterns, and project future demand. Precision forecasting like this ensures optimized inventory levels, preventing both stockouts and surplus stock, and saving you money.
- BI tools give retailers the capacity to forecast consumer demand and reduce supply chain errors by 20-50%, slashing lost sales by up to half
- Customer Segmentation: BI facilitates granular customer segmentation based on diverse criteria such as purchasing behavior, demographics, and customer preferences. BI tools let you capitalize on these insights to craft targeted marketing campaigns, personalized promotions, and tailored product recommendations.
- In recent years, retailers who use BI tools for customer segmentation report seeing a 25% increase in conversion rates due to personalized marketing campaigns
- Price Optimization: Remain competitive by scrutinizing pricing data and competitor trends in real-time. BI tools give retailers the ability to set dynamic prices that maximize sales and profitability, and ensure alignment with prevailing market conditions.
- Did you know: Retailers who use BI tools see an average of 2-5% increase in profit margins per year versus their competitors?
- Marketing Effectiveness: Want to see how your marketing campaign is performing before the big event? BI tools let you evaluate the efficacy of pre-Black Friday marketing campaigns by analyzing metrics such as website traffic, social media engagement, and conversion rates to decide on the most successful channels and strategies.
- On average, retailers using BI tools report an 8-12% increase in ROI on targeted marketing campaigns, thanks to their ability to adjust in real time based on data.
- Inventory Management: BI’s real-time monitoring of inventory levels mitigates the risks of both stock outs and overstock situations. This precision ensures a seamless shopping experience for customers and minimizes unnecessary costs.
- The predictive analytics of BI tools lead to a 15% reduction in inventory costs, on average per year, while ensuring the availability of high-demand product.
- Operational Efficiency: BI tools grease the wheels of your whole operation. Streamline supply chain processes, optimize order fulfillment, and enhance overall operational efficiency with insights from BI tools. Identify areas for improvement and ensure a frictionless Black Friday sales experience.
- In 2022, retailers reported that using BI tools enabled a 65% increase in overall efficiency, with smoother ordering and delivery processes
- Real-time Monitoring: BI dashboards furnish real-time monitoring of key performance indicators (KPIs) during Black Friday. This instantaneous feedback lets businesses swiftly identify and address issues, capitalize on opportunities, and make data-driven decisions on-the-fly.
- Fraud Detection: Safeguard Black Friday transactions by leveraging BI’s capabilities in identifying and preventing fraudulent activities. Analyze transaction patterns to promptly flag and address suspicious behavior.
- Forget manually poring over data: BI tools can detect fraud with over 90% accuracy by analyzing vast amounts of real-time data from multiple sources, such as financial transactions, customer behavior, and inventory levels, allowing you to stem and recoup losses faster
- Post-Event Analysis: Like ESPN commentators after the Superbowl, BI tools facilitate a comprehensive analysis of sales performance, customer behavior, and campaign effectiveness post-Black Friday. This critical information can help inform future sales strategies and improvements.
- Real-world utility: Not all retail events are revenue-generating. After the 2008 economic collapse, Oberweis Dairy, a retail producer of dairy products, utilized BI tools to analyze customer retention. These tools gave them a 35% improvement in customer retention rates by adjusting promotional strategies based on the data
- Mobile Analytics: In response to the surge in mobile shopping, BI provides insights into mobile app usage, user experience, and conversion rates. Optimize your mobile platforms for Black Friday, ensuring a seamless and responsive user journey.
Practically Speaking: Business Intelligence Tools Put to Use
Armed with an idea of which Business Intelligence tools are trusted amongst retailers and what they aim to accomplish, the judicious business owner is interested in how these tools achieve end results.
Leveraging Location Intelligence in Retail BI
Location intelligence is a critical component of retail business intelligence, and has a direct impact on optimization for traditional and e-commerce retail.
Essentially, it provides intel into actual customer behavior within physical stores. Using this real-time data, retailers are able to pivot their strategies quickly and take action, such as changing store layouts, product placements, and marketing strategies based on store or region.
Ever walk into a well-known chain retail store in another county or state, expecting it to look like the one you frequent at home, but you can’t quite get your bearings? All those tweaks and differences are by design, thanks to location intelligence. Regional demographics, population size, store traffic, and countless other metrics went into designing that retail location. It makes sense to retailers: over half of business intelligence professionals recognize location data as essential for enhancing consumer insights. By leveraging location data, retailers can make more informed decisions about store layouts, product placements, and marketing strategies.
If location intelligence tools operated on their own, they wouldn’t address the whole picture. Luckily, they can seamlessly integrate with existing systems, giving retailers a meta-view of their entire supply chain. Location intelligence allows for flexibility and enables personalized in-store product recommendations, based on data, to enhance customer experience.
Retailers can also utilize indoor mapping and spatial interaction models to optimize store layout. This is more important to the revenue of brick-and-mortar retailers than you might think: visual information is 75% of what our brains take in, so removing visual barriers can have a dramatic impact on retail conversion rate.
Integrating Location and BI Tools to Optimize Retail Outcomes
- Site Selection: Location intelligence helps retailers decide where to open new stores by analyzing factors like foot traffic, demographics, and competition in specific areas. By using geographic data, retailers can ensure they choose locations with high potential for customer engagement and sales.
- Customer Behavior Analysis: Retailers can analyze the movement patterns of customers in and around store locations, providing insight into how customers interact with stores and what factors influence their purchasing decisions. For instance, tracking customer visits to certain locations can inform targeted marketing efforts or store layout adjustments. The numbers speak for themselves: retailers who’ve adopted location intelligence enjoy a:
- Supply Chain and Logistics Optimization: Location data can enhance logistics by optimizing delivery routes and warehouse placements. This helps retailers reduce shipping costs, minimize delivery times, and improve overall supply chain efficiency. Improving supply chains helps with route planning, leading to an average 6% reduction in fuel costs.
- Personalized Marketing: By analyzing location data from mobile devices or customer loyalty programs, retailers can deliver personalized, location-based promotions to consumers. This allows for more targeted and timely marketing strategies, improving customer engagement.
- Inventory Management: Location intelligence can assist in demand forecasting by understanding regional preferences, seasonal trends, and local purchasing habits. This helps retailers maintain optimal inventory levels in different stores.
Enhancing Store Performance
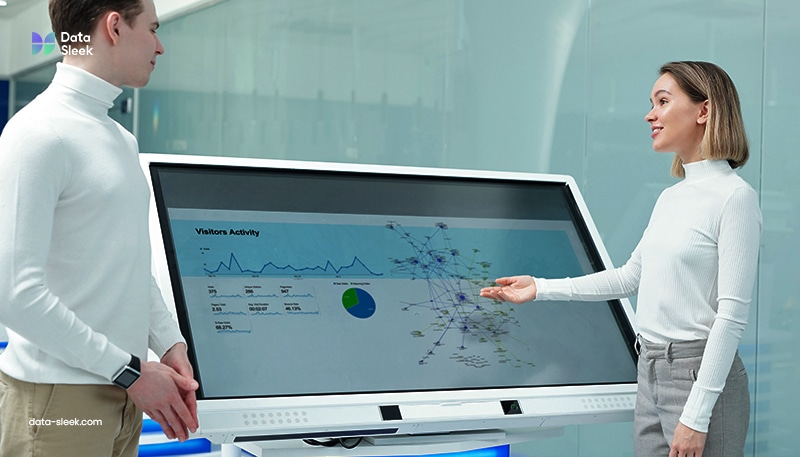
One of the great advantages of BI tools is their ability to parse sales data and customer foot traffic, both of which can have dramatic effects on store performance. Putting BI tools to work can help with:
- Analyzing foot traffic data helps retailers optimize store hours and staffing schedules to meet customer needs, without wasting money on overstaffing.
- Evaluating customer loyalty metrics, supporting targeted improvements in store operations and customer engagement.
- Uncovering revealing information, like peak shopping times, and adjusting store hours or identifying high-traffic areas to optimize product placement.
These data-driven insights lead to more efficient operations and improved customer satisfaction.
Personalizing Customer Experiences: Mind Reading or Business Intelligence?
Have you ever gotten the eerie feeling that your devices are listening to you, or even reading your mind? Rest assured, we’re still a way off from living amongst clairvoyant smartphones, but there’s a reason so many of us know the experience. Part of the reason lies in the beauty of Business Intelligence tools, which seamlessly integrate with CRM (customer relationship management) systems.
These integrated systems analyze customer behavior, which allows retailers to create targeted promotions that resonate with specific audience segments. Given that about 86% of customers are willing to pay more for a superior customer experience, it’s a safe bet that enhancing customer engagement and satisfaction using BI tools has a direct impact on the bottom line.
Customer segmentation through BI tools allows retailers to tailor marketing campaigns to distinct customer preferences. By analyzing customer behavior, retailers can create targeted promotions that scratch a particular itch with specific audience segments, which differentiates your business from the competition. A whopping 81% of surveyed customers identified their personalized experience as a key competitive differentiator. So to make sure you’re head and shoulders above your competition, make sure you’ve got an integrated BI strategy in place to give your customers the experience they expect.
Integration of BI with customer relationship management (CRM) systems further enables personalized marketing strategies by providing a whole, holistic view of customer interactions and purchase histories. Prioritizing the customer experience is essential to longevity, because 66% of consumers will abandon a brand if they aren’t getting a tailored shopping experience. This approach not only improves the effectiveness of marketing campaigns but also fosters stronger customer relationships and loyalty.
Looking Ahead: Business Intelligence for Tomorrow
The future of retail BI is poised for significant advancements, driven by the integration of advanced analytics and AI capabilities. Predictive analytics will continue to play a critical role in forecasting trends and helping retailers stay ahead of market demands. Tools like QlikSense, with its sophisticated AI capabilities and high-performance cloud platforms, exemplify the direction in which the industry is heading.
Globally, the pace at which retailers are joining the ranks and becoming users of business intelligence tools is growing at a steady clip. The business intelligence industry is projected to reach a value of $61.86 billion by 2029, which only reinforces the primacy of BI tools in driving business performance. As retailers increasingly adopt these tools, we can expect to see more innovations that enhance data analysis, improve customer experiences, and optimize operations. If you’re tired of waiting all year for Black Friday to roll around, it’s time to let business intelligence tools elevate your business to the retail pantheon. Consider setting up a free consultation with Data-Sleek® and let’s work together to take your retail data management game to the next level.


